Figure 8.
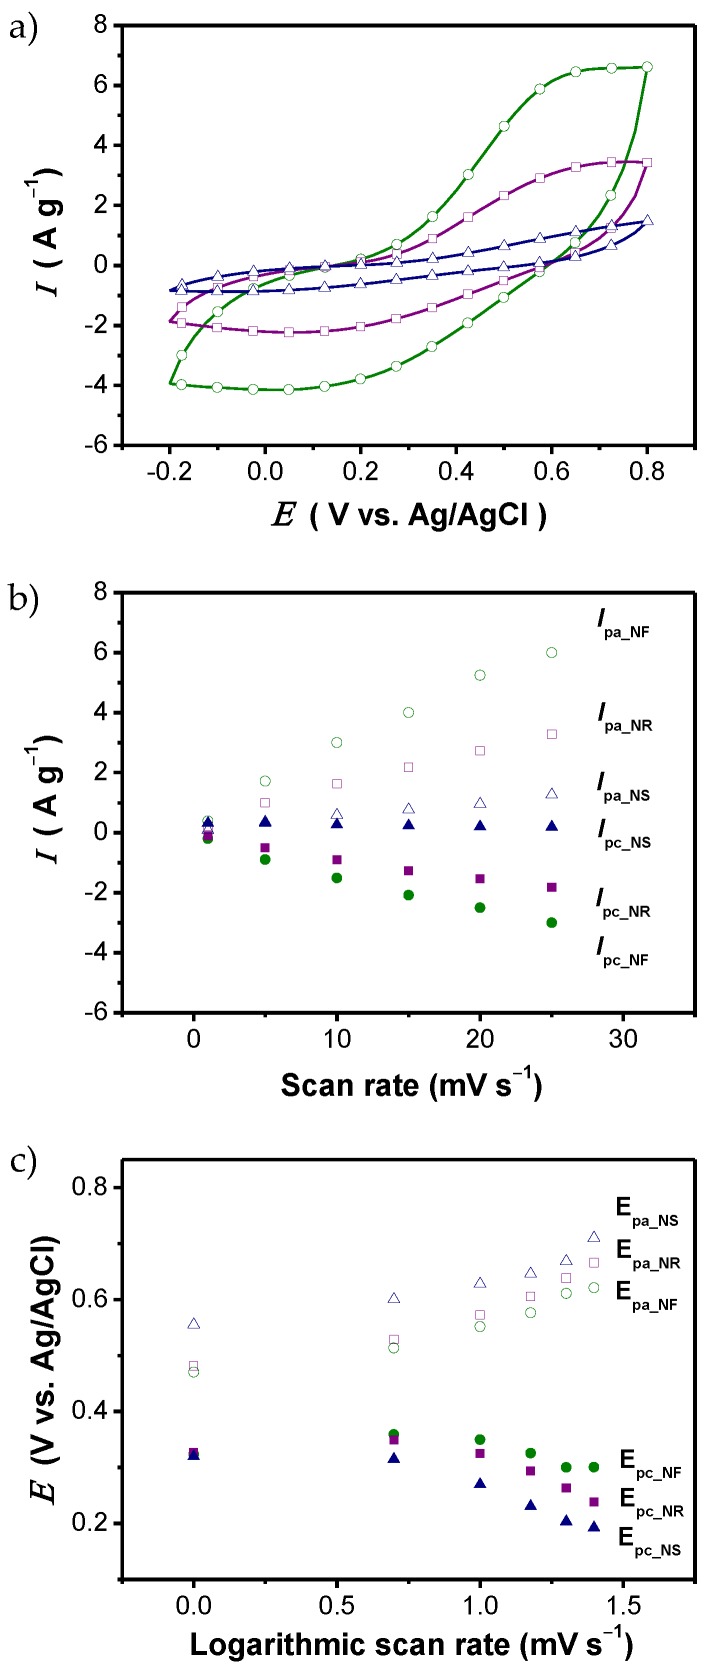
CV analysis of PANI nanostructures with three different shapes (nanosphere, NS; nanorods, NR; and nanofibers, NF) performed in a 1 M sulfuric acid solution. (a) Cyclic voltammograms of electrodes consisting of PANI nanostructures at the same scan rate (25 mV·s−1); (b) plots of the peak current (the anodic peak current, Ipa; the cathodic peak current, Ipc) vs. the scan rate; and (c) plots of the peak potential (the anodic peak potential, Epa; the cathodic peak current, Epc) vs. the log of the scan rate. With permission from [86]; Copyright 2012, American Chemical Society.

