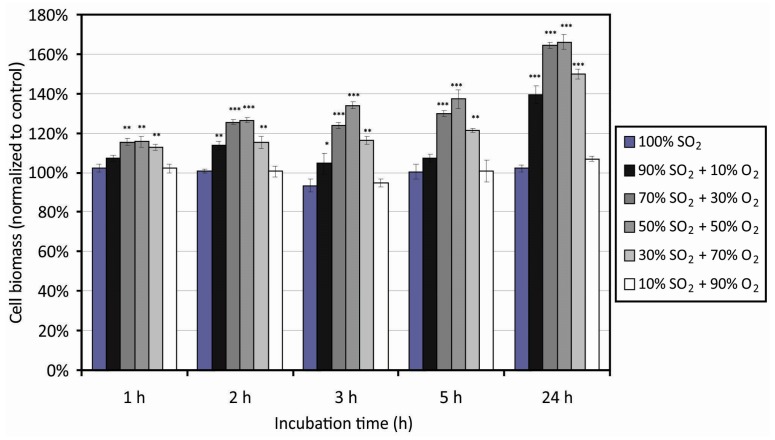
Figure 10.
Surface cytotoxicity of PET surfaces treated in various SO2 + O2 mixtures. * represents statistical significance (* statistically significant at p < 0.05 compared with the control. ** represents statistical significance at p < 0.01 compared with the control. *** represents statistical significance at p < 0.001 compared with the control). Mean values ( ± SE) for the respective triplicates are given.

