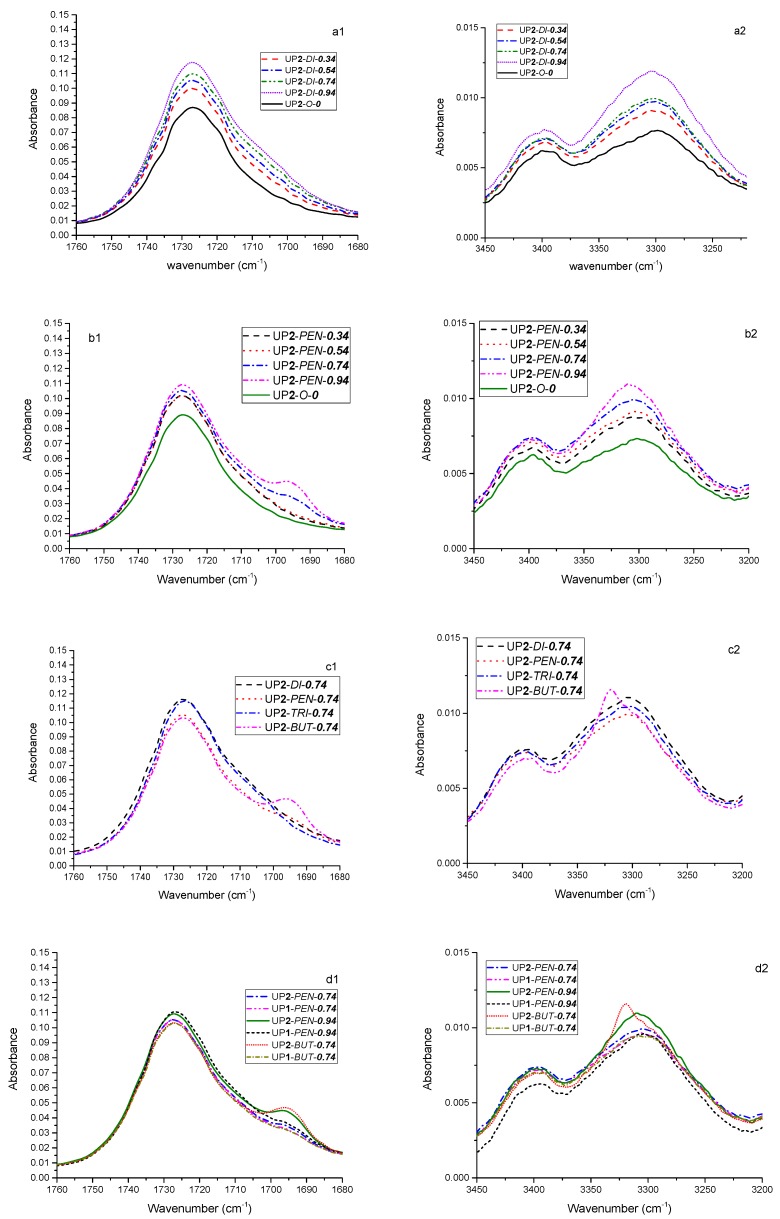
Figure 7.
Comparison of ATR-FTIR spectra at the C=O stretching band ranging 1680–1760cm−1 (left) and N-H stretching band ranging 3200–3450 cm−1 (right): (a1,a2) samples prepared by the two-stage process with varying di-PPG amount compared with the blank sample UP1-O-0; (b1,b2) samples prepared by the two-stage process with varying pentanediol amount compared with the blank sample UP1-O-0; (c1,c2) samples prepared by two-stage process with 0.74 molar ratio of different chain extenders; (d1,d2) selected samples prepared by the two different synthesis processes.

