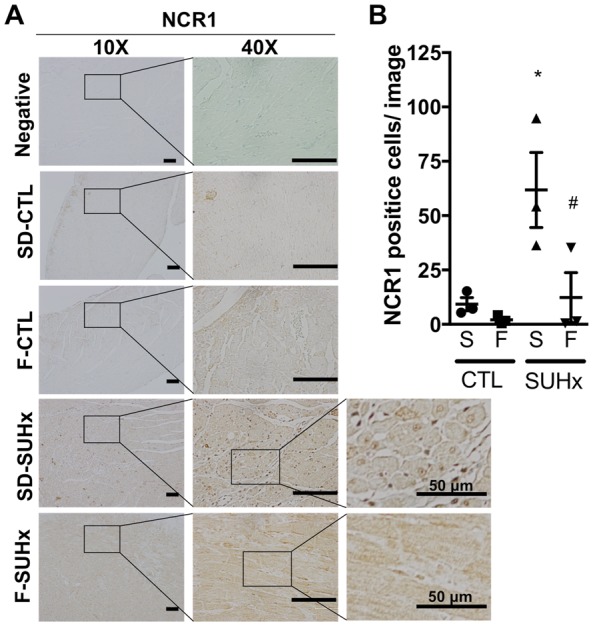
Figure 7.

Natural killer (NK) cell infiltration in the RV. (A) Representative images (scale bar = 100 μm for 10X and 40X images) and (B) bar graph demonstrating NCR1 positive natural killer cell infiltration in the RV of Fischer CTL, SD CTL, SD SUHx and Fischer SUHx rats. Statistical analysis using One-way ANOVA with Tukey’s multiple comparisons test. *P < 0.05 vs CTL; #P < 0.05 vs SD-SUHx. N = 3 per group.
