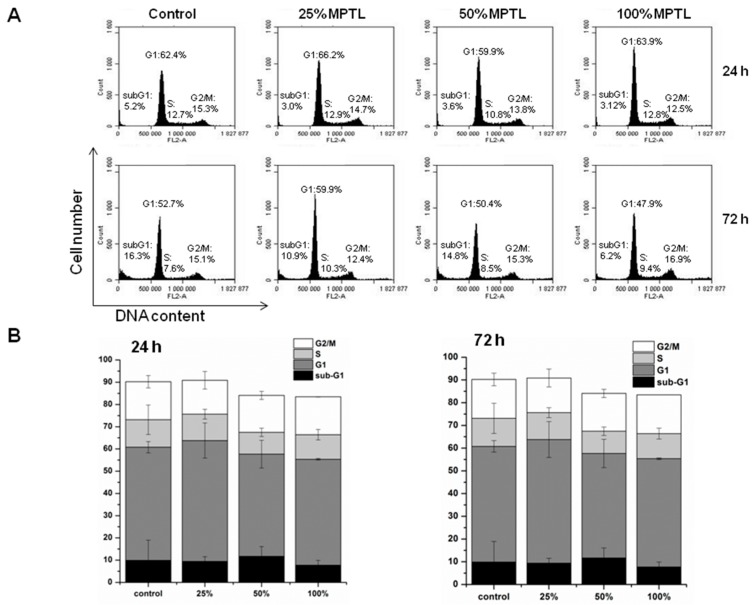
Figure 9.
The effect of MPTL extracts on mouse embryonic NIH 3T3 fibroblasts cell cycle distribution. Following MPTL extract treatment, cells were stained with propidium iodide and percentages of cells in the subG1, G1, S and G2/M phases were determined by flow cytometry. (A) Representative DNA content histograms. Cells in G2/M phases have double the DNA content than those in G1 phase. S-phase cells have DNA content lying between that for G1 and G2/M phases. The sub-G1 region represents apoptotic cells with fragmented DNA; (B) Summaries of changes in the percentage of cells in different cell cycle phases, as assessed in the experiments shown in (A). Results are the mean ± SD of two independent experiments.

