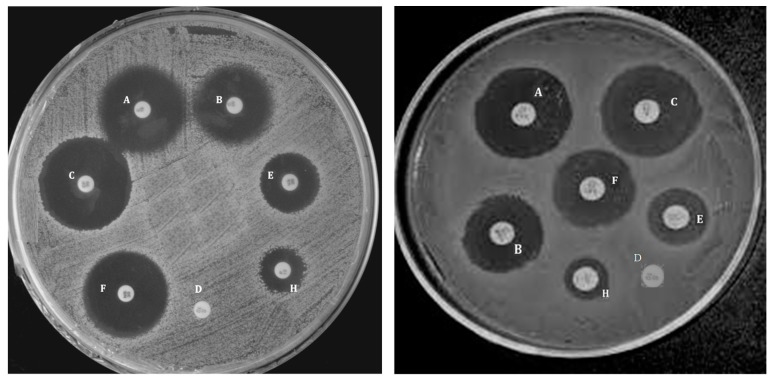
Figure 12.
Inhibition zone of PPF/PEG-g-BNNTs nanocomposites on E. coli (left) and S. aureus (right) measured via the agar-diffusion technique. The wells corresponding to each nanocomposite loading are the following: (A) 4.0 wt %; (B) 1.0 wt %; (C) 0 wt % (positive control); (D) 0 wt % (PPF); (E) 0.5 wt %; (F) 2.0 wt %; (H) 0.1 wt %. Reprinted from [14], with permission from the Royal Society of Chemistry.

