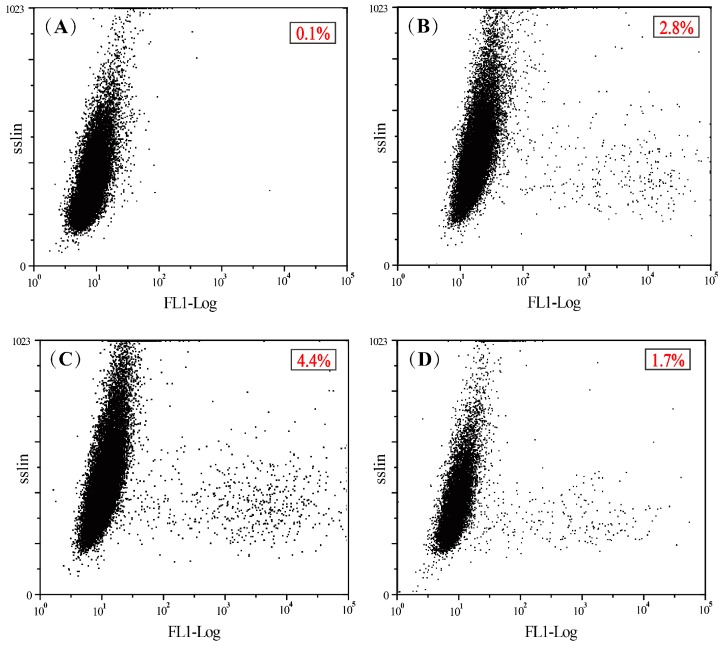
Figure 10.
The transfection efficiency quantified by the measurement of GFP expression with flow cytometry. (A) Cells treated with naked Pdna; (B) cells treated with PLGA-g-PEI/pDNA gene complexes; (C) cells treated with PLGA-g-PEI-g-CAGW/pDNA gene complexes; (D) cells treated with PEI (10 kDa)/pDNA gene complexes.

