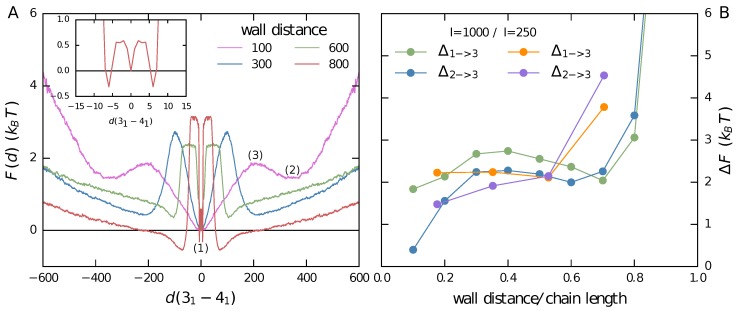
Figure 4.
Free energy landscape. (A) Free energy landscapes of the knot distance for different end-to-end distances . The inset shows the triple peak structure of the intertwined states at the largest wall distance (800) that was already observed in shorter chains [42]; (B) Free energy barriers for different wall distances. The differences in the free energy distribution between the local maximum of the barrier (3) and the local minima corresponding to the intertwined state (1) as well as the separated state (2) are plotted in green and blue for l = 1000 and in orange and purple for l = 250 [42].

