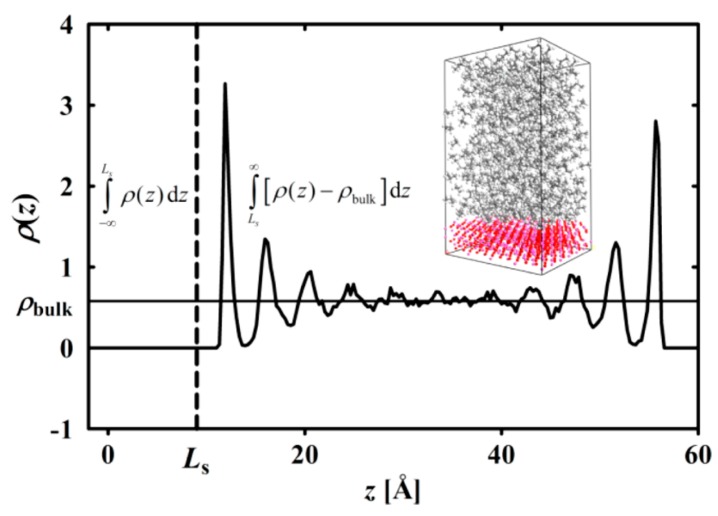
Figure 7.
Number density profile from atomistic MD simulations. Molecular center-of-mass of a particular bead is used in computation of the profiles. Vertical line is the location of the substrate surface and defines the integration boundaries. A pictorial representation of the atomistic simulation box snapshot is given as the inset picture. Reprinted with permission from Kacar et al. [203]. Copyright 2016 American Chemical Society.

