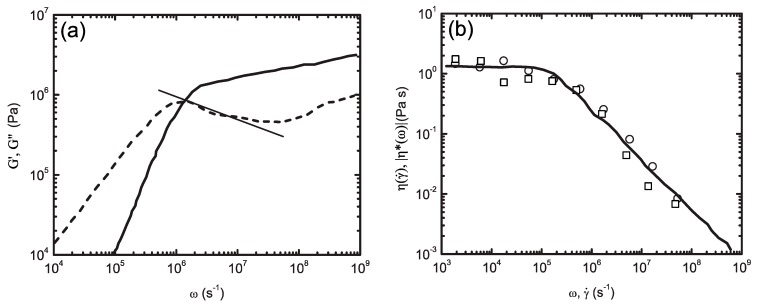
Figure 8.
(a) Storage and loss moduli (full and dashed lines, respectively); and (b) the flow curve for C800H1602 melt at 450 K. Reprinted from Kindt and Briels [404] with the permission of AIP Publishing. The solid line in (b) is derived in equilibrium simulations using the Cox-Merz rule. The circles and squares are simulation results under shear benefitting from linear background and variable flow field methods, respectively. For further information regarding the data shown in figure refer to the cited work and the references within it.

