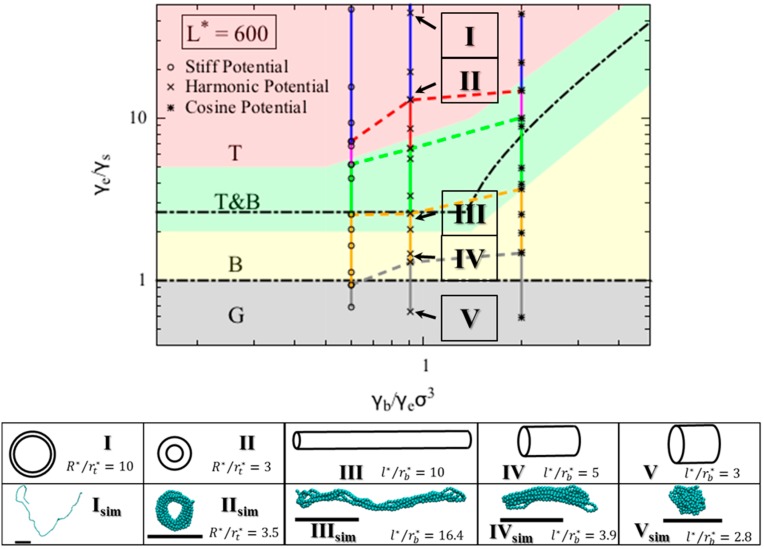
Figure 3.
Phase diagrams for polymer chain with dimensionless chain length L* = L/σ = 600. Each symbol on the phase diagram marks the parameter values at which a simulation was conducted. Specifically, open circles, crosses, and asterisk symbols are the simulation runs using stiff, harmonic, and cosine bending potentials respectively. A vertical bar connects simulations data producing the same type of structure. The color of the vertical bars, of the dashed lines, and of the regions of the diagram producing this structure coded as follows: blue—random coil (RC), pink—fluctuating between random coil and torus (RC&T), red—torus (T), green—fluctuating between torus and bundle (T&B), yellow—bundle (B), and black- globule (G). Note the pink and blue regions only occur in simulations because we do not model random coil phase. We regard the simulated T&RC phase simply as a torus phase (T) because we do not model the random coil (RC) phase analytically. The dashed lines connecting the vertical bars mark the upper boundaries of the phases obtained from the simulations (e.g., simulation results between yellow and grey dashed lines resulted in a bundle as the final collapsed structure). Exact solutions for the boundaries between the three collapsed phases are shown on the phase diagram (black dash-dotted lines). We have selected representative conformations in each phase, pointed by the arrows. We have calculated the theoretical aspect ratios for these conformations, depicted in the insets I–V. We have also conducted simulations using harmonic bending potential under the same conditions, and the final snapshots from the simulations are supplied in additional insets I–V with subscript “sim”.

