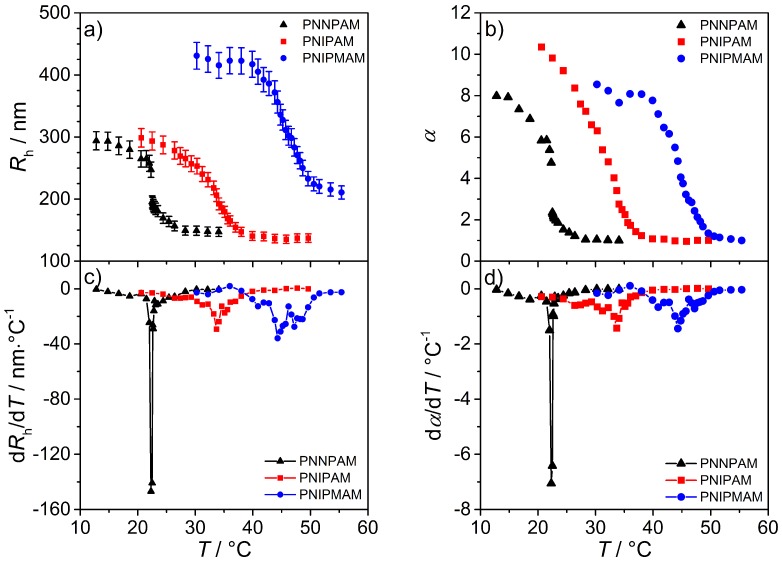
Figure 8.
The swelling curves show the change of the microgel hydrodynamic radius (a) and the swelling ratio α (b) as a function of temperature for all three homopolymers. The graphs (c) and (d) represent the numerically calculated first derivative of the swelling curves. The point of inflection is the volume phase transition temperature (VPTT) of the system.

