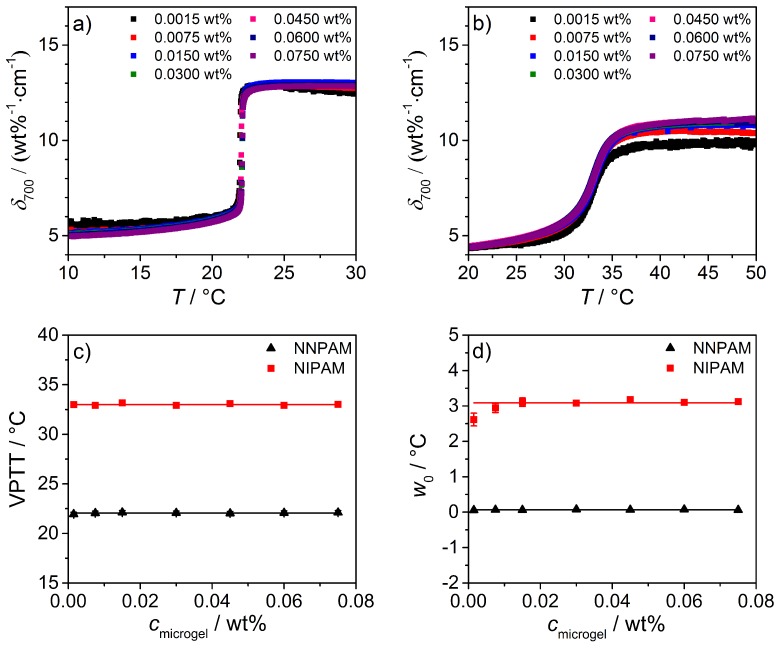
Figure 11.
Normalized light attenuation coefficients for PNNPAM (a) and PNIPAM (b) microgels solutions with different concentrations as a function of temperature (λ = 700 nm). In graphs (c) and (d), a summary of the VPTTs and the -values for both microgels as a function of sample concentration is given. The solid lines correspond to the average value. It has to be mentioned that for PNIPAM the first -value (0.0015 wt %) has been neglected.

