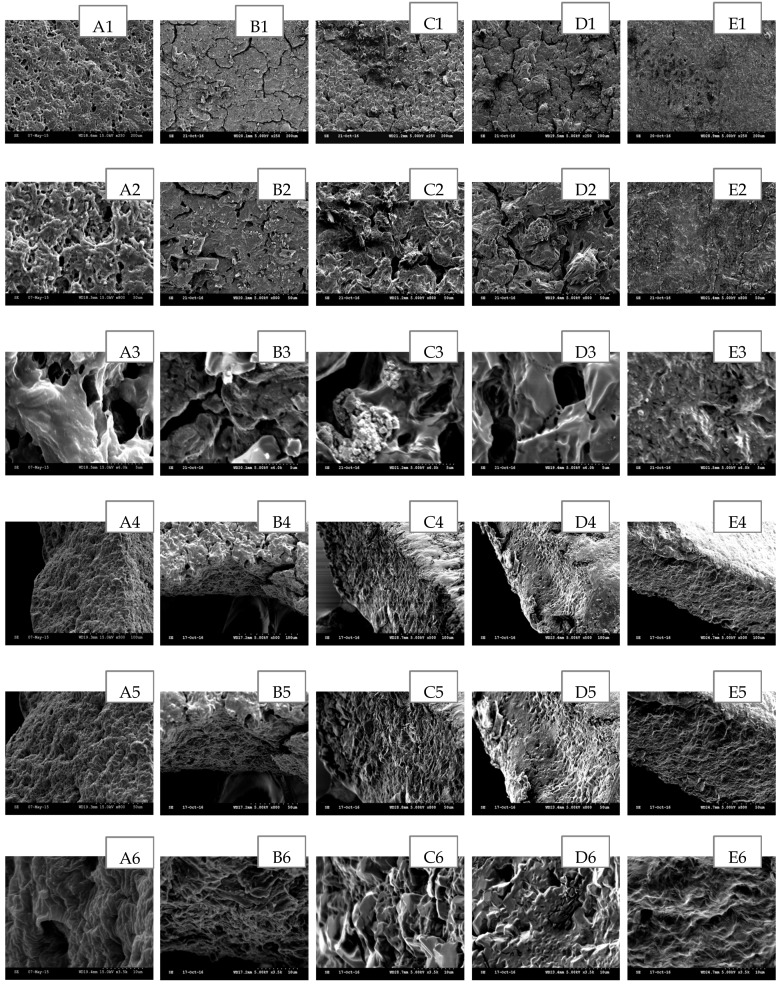
Figure 2.
SEM images of post-loaded LID hydrogel network in comparison to unmedicated hydrogel cross-linked with 5% w/w PETRA. (A) Unmedicated PEO, (B) PEO-LID 1.18% w/w (25% saturation), (C) PEO-LID 3.64% w/w (50% saturation), (D) PEO-LID 6.31% w/w (75% saturation), (E) PEO-LID 9.75% w/w (100% saturation). Scale bars are 100, 50 and 5 μm for micrographs featuring the outer surface of hydrogel network (1–3), 100, 50, and 10 μm for micrographs featuring the cross section of hydrogel network (4–6).

