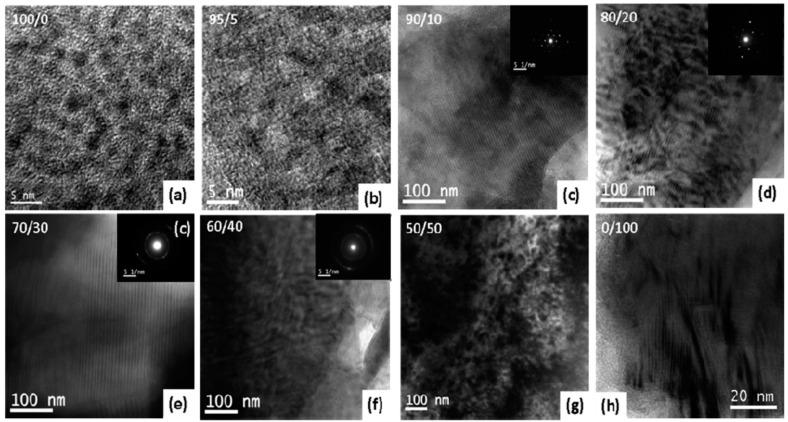
Figure 18.
The TEM images and their corresponding SAED patterns of PA-T/OBA-POSS nanocomposites with different OBA-POSS contents of (a) 100/0, (b) 95/5, (c) 90/10, (d) 80/20, (e) 70/30, (f) 60/40, (g) 50/50, and (h) 0/100 [117]. Reproduced with permission from American Chemical Society.

