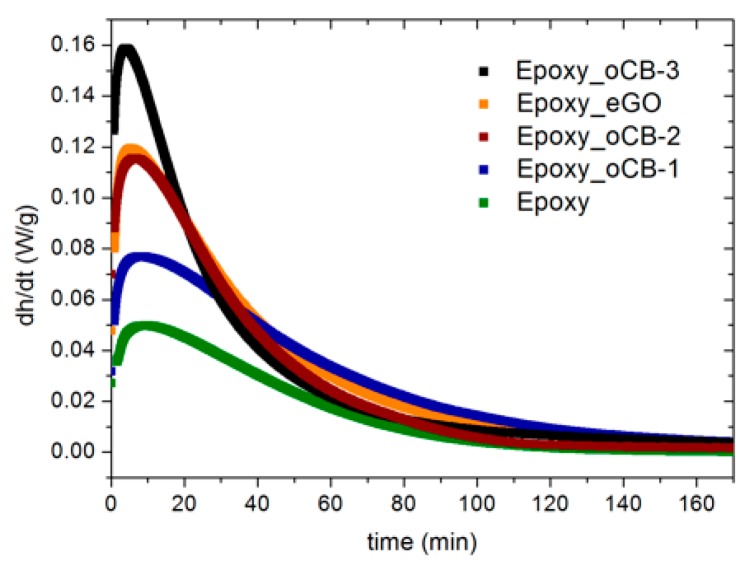
Figure 6.
Isothermal DSC scans at 50 °C of the DGEBA-IPDA epoxy resin. The lowest curve (green) corresponds to the neat epoxy resin. The other curves correspond to the epoxy resin filled by 3 wt % of different nanofillers: oCB-1 (O/C, wt/wt = 0.16) (blue); oCB-2 (O/C, wt/wt = 0.83) (wine) oCB-3 (O/C, wt/wt = 0.91) (black); eGO (O/C, wt/wt = 0.62) (orange).

