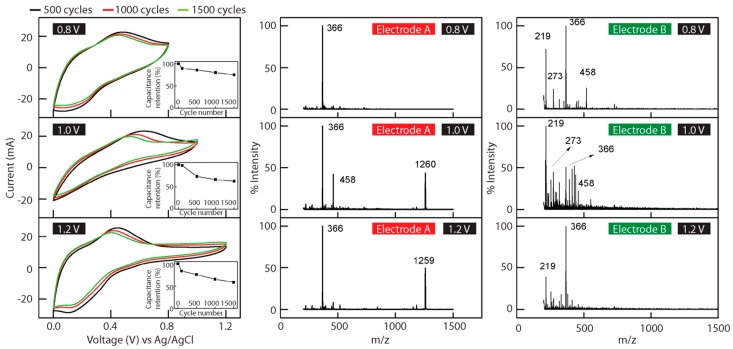
Figure 6.
Select cyclic voltammetry spectra, taken throughout device cycling tests under different potential windows with their corresponding MALDI TOF spectra from electrodes A and B, showing peak polymerization and degradation after cycling. Inserts in the CV diagram plots show the percent capacitance retention as a function of cycle number.

