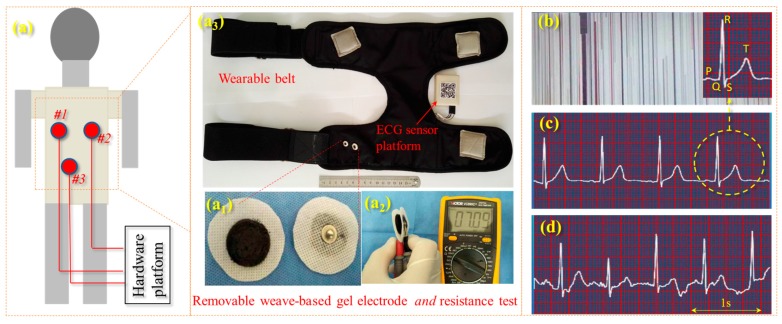
Figure 7.
ECG acquisition process: (a) electrode distribution on the human body where (a1) shows our self-developed conductive hydrogel-based electrodes, (a2) shows the tested resistance of a pair of electrodes, and (a3) shows the self-developed ECG monitoring belt and integrated circuit for signal processing; (b) ECG noise when the belt does use the developed gel electrode, the inset shows a typical unit of ECG signal with characteristic waves of P, Q, R, S, and T respectively; (c) ECG signal for a human in a static state; and (d) the ECG signal for a human in a walking state. The scale bar represents 0.25 s per unit length for recording the heart rate.

