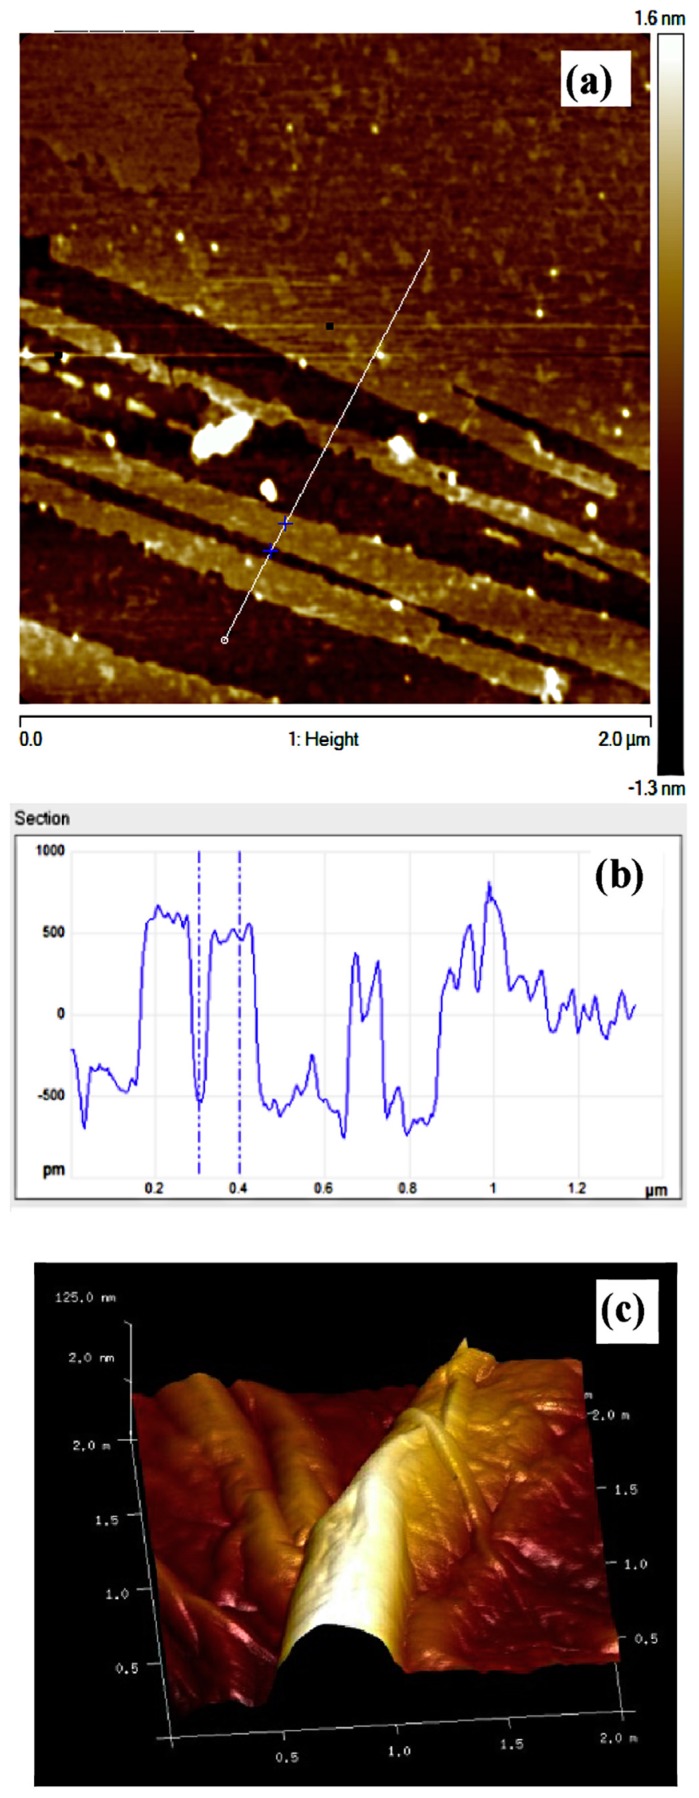
Figure 4.
AFM images of the as prepared graphene oxide (GO) sample. (a) top view; (b) height profile of the region marked by the white line through the crosses in panel (a); (c) 3D view evidencing the wrinkling size. Reprinted from [118] with permission from Elsevier.

