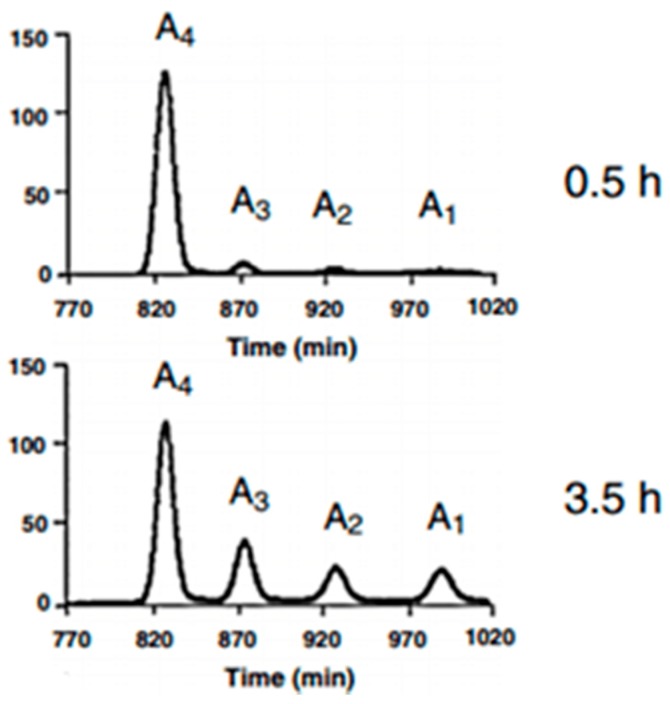
Figure 8.
Illustration of the size-distribution of the molar fraction after hydrolysis of chitosan (diagram from Einbu et al., 2007 [27]). The gel filtration chromatograms (SuperdexTM30) display peaks of the tetramer (A4), trimer (A3), dimer (A2) and monomer (A1)).

