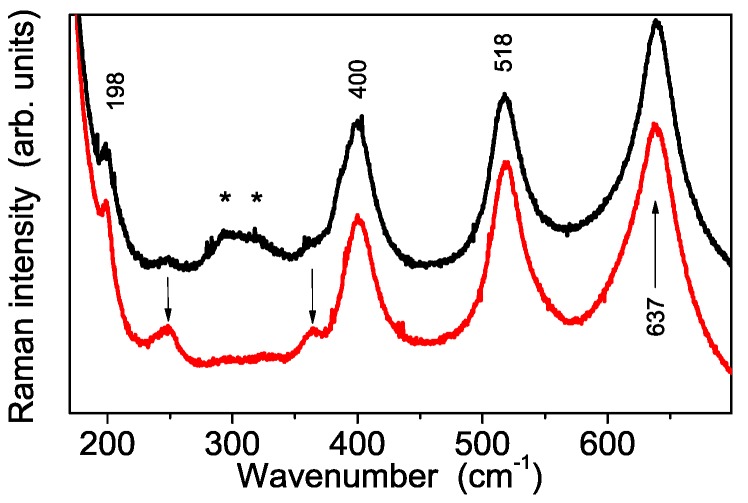
Figure 9.
Experimental Raman spectra carried out in the low wavenumber region on S-TiO2 nanopowder sample (red trace) and on nanocomposite membrane loaded by 7% w/w of S-TiO2 (black trace). The two arrows indicate the TiO2-B phase modes at about 250 and 310 cm−1, respectively, while the pair of stars (*) labels the Nafion peaks at about 292 cm−1 (t(CF2)) and 310 cm−1, assigned to the t(CF2) mode [25].

