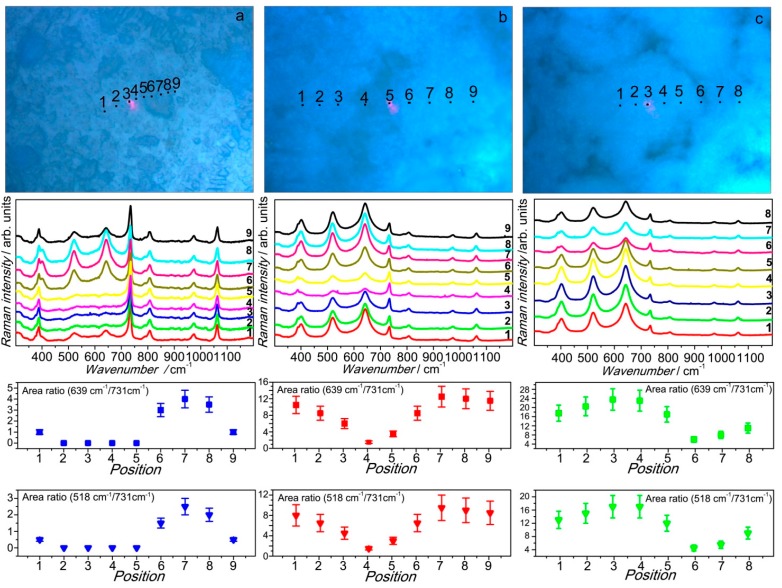
Figure 11.
Raman mapping of the three composite membranes: 2-TiO2-S (a) 5-TiO2-S (b) and 7-TiO2-S (c). For each sample, the upper panel shows the optical microscopy image, the middle one the Raman spectra in the different samples. The red spot observed in the optical images is the laser beam, whose size is of the order of 1 micron.

