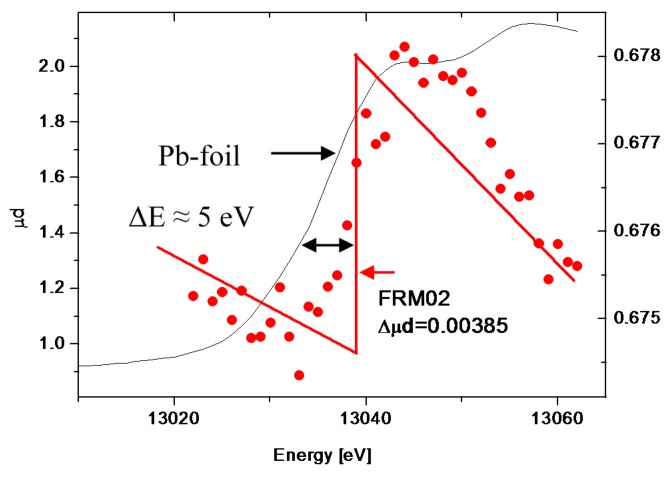
Figure 3.
XANES spectrum of FRM02 measured at the Pb LIII-edge at 13,035 eV. The solid (black) line represents the XANES spectrum of a Pb-metal foil (y-axis on the left). The FRM02 spectrum reveals a chemical shift of about 5 eV. Δμd is the difference of the absorption coefficient times the sample thickness and represents the Pb-LIII-edge of the sample taken from the y-axis on the right.

