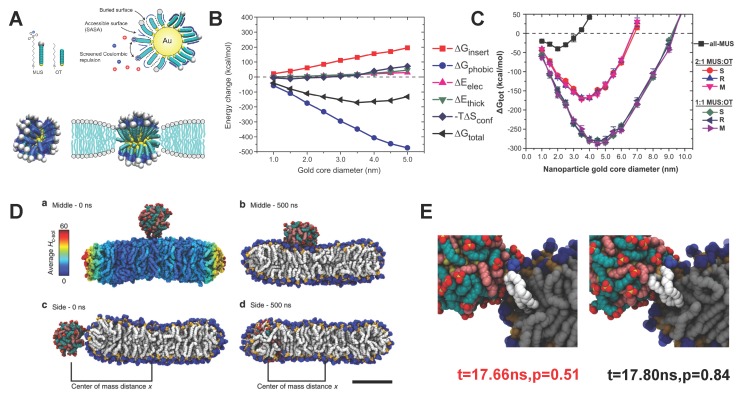
Figure 5.
Free energy and kinetic barrier analysis for penetration of amphiphilic polymer-decorated NPs. (A) (Upper part) Schematic of the solvent-accessible surface area (SASA), a parameter of the hydrophobic free energy, and electrostatic interactions; (Lower part) comparison between the initial and final stable states of the amphiphilic polymer-decorated NPs. The hydrophilic ligands are squeezed out of the bilayer’s hydrophobic region, forming a so-called “snorkeling” phenomenon; (B) Decomposition of the free energy during the NP penetration process. is the total free energy change. is the change of hydrophobic energy, determined through the SASA. is the electrostatic energy change. is the free energy change corresponding to deformation of the lipid bilayer. is the conformation entropy change of the decorated amphiphilic polymers; (C) Total free energy change as a function of NP diameter and monolayer composition. The ligand density on the Au NPs is kept constant; (D) Snapshots of the initial and final states of the NPs interacting with a lipid bilayer. For the case of 1:1 MUS:OT NP on the top of the bilayer, it cannot penetrate into the bilayer (Upper part); while it can penetrate in the bilayer through the edge (Lower part); (E) Snapshots of the transition states during NP penetration through the edge of a bilayer. At the transition time (t = 17.66 ns), the protruding lipids were in contact with the amphiphilic NP. The figures are adapted from References [52,54,57,63] with permission.

