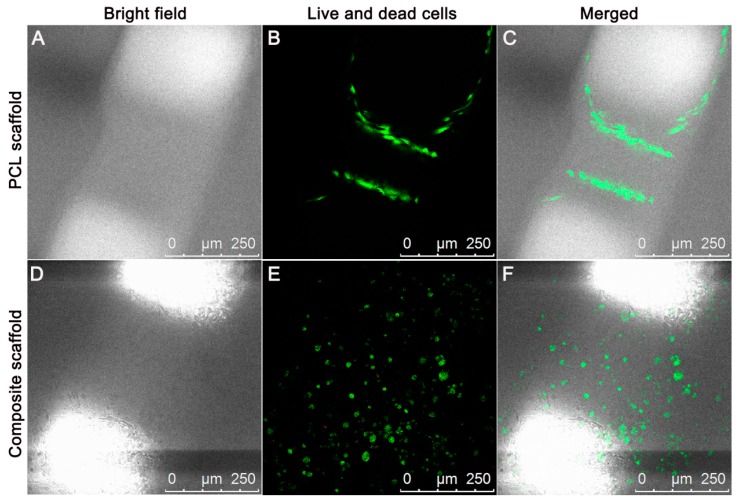
Figure 4.
Representative images of attachment, viability, and distribution of BMMSCs in PCL scaffold (A–C) and composite scaffold (D–F). Bright field views show the contours of the PCL scaffold and composite (A,D). The dark area indicates the PCL fibers, and the bright area is the scaffold pores. CFLM images of LIVE/DEAD staining demonstrated in vitro cell viability and proliferation of three groups after culture for 72 h (B,E). The distribution of BMMSCs on the PCL scaffold and PCL/Gel composite scaffold were shown in the merged images (C,F). (Red, dead cells; green, live cells; scale bar = 250 μm). CCK-8 assay and DNA content showed that the increased number of cells in the three groups over time (G,H). GAG deposition in various scaffolds by embedded BMMSCs (I). Results are expressed as mean ± SD (n = 3; * p < 0.05, ** p < 0.01, *** p < 0.001).


