. 2019 Feb 21;10(12):3608–3615. doi: 10.1039/c9sc00341j

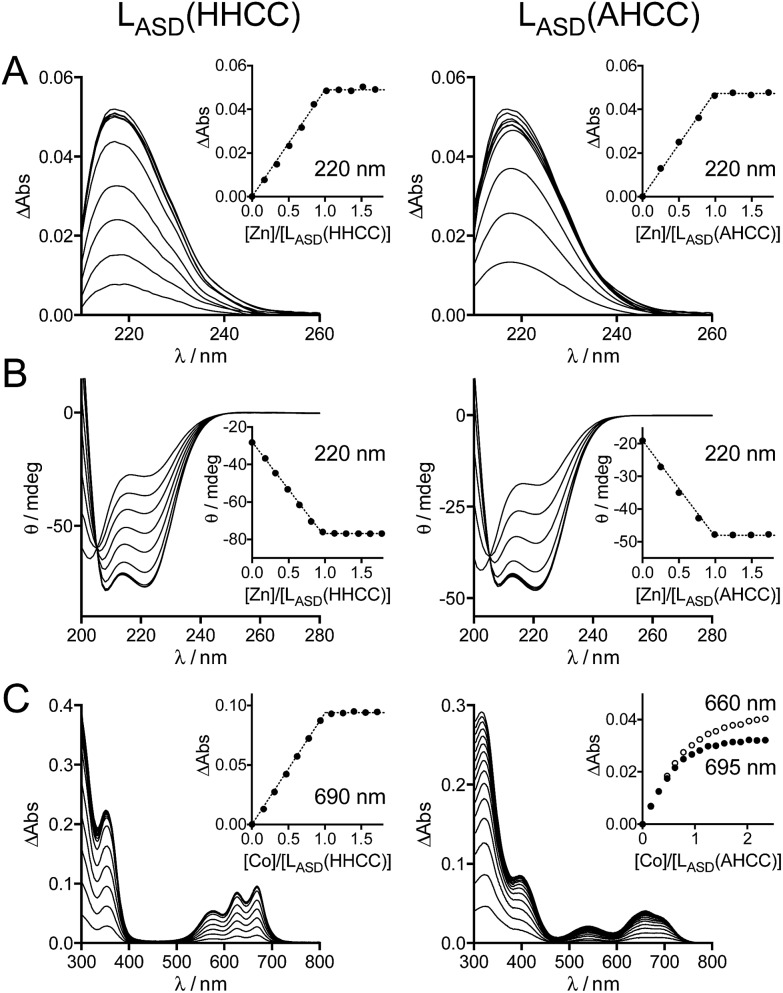
Fig. 3. UV-Vis absorption and CD characterization of LASD(HHCC) and LASD(AHCC). (A) Absorption and (B) CD monitoring of Zn2+ titrations of LASD(HHCC) (19 μM, left) and LASD(AHCC) (14 μM, right) in phosphate buffer (20 mM, pH 7.0) containing TCEP (500 μM) with inserts showing the evolution of the absorbance at 220 nm. For absorption, the spectrum of the metal-free peptide was subtracted from each spectrum. (C) Absorption monitoring of Co2+ titrations of LASD(HHCC) (153 μM, left) and LASD(AHCC) (110 μM, right) in phosphate buffer (20 mM, pH 7.0) containing TCEP (500 μM) with inserts showing the evolution of the absorbance at 690 nm for LASD(HHCC) and 660 and 695 nm for LASD(AHCC).

Fig. 3