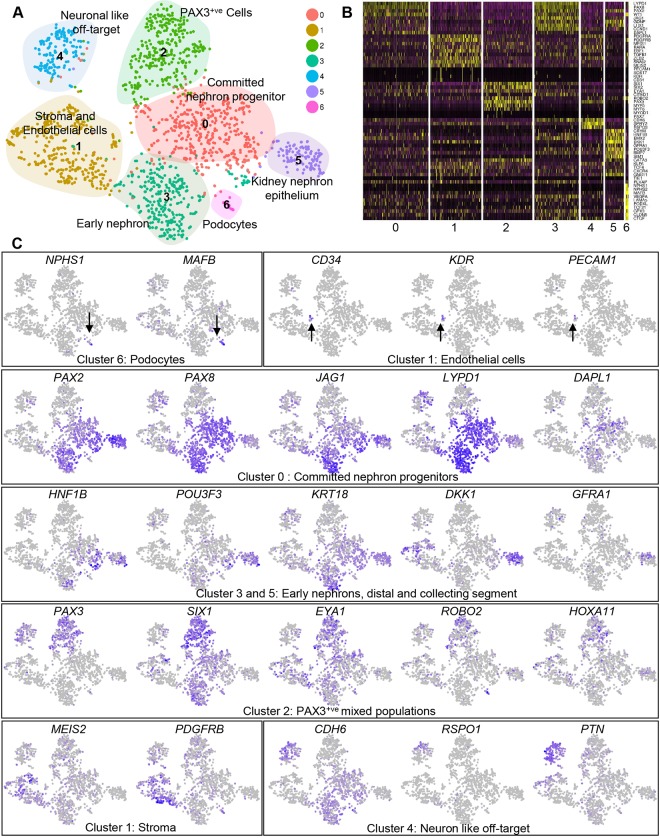
Fig. 2.
Transcriptional validation of kidney differentiation within micro-organoids. (A) t-SNE plot after Seurat clustering of single cell RNA-seq of day 7+18 CRL1502-C32 micro-organoids showing 7 different clusters. (B) Heat-map showing scaled gene expression of key marker genes within clusters. (C) t-SNE plots indicating the expression of key marker genes for selected nephron cell types. Colour intensity is scaled per gene, darker blue indicates higher expression. Arrows indicate podocytes and endothelial cells.

