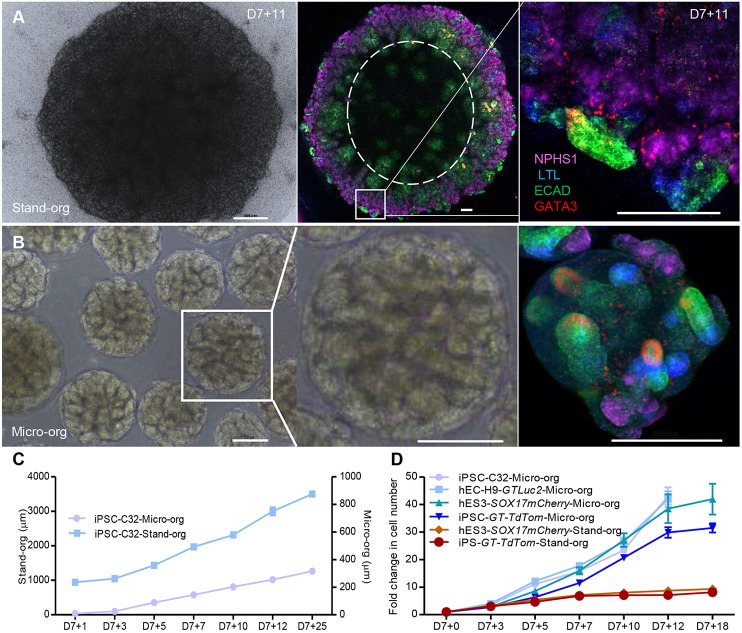
Fig. 4.
Kidney micro-organoids provide a better platform for efficient hPSC-derived kidney cell scale-up. (A) Bright-field image of standard kidney organoid at day 7+11 (left), confocal immunofluorescence image (tile scan) of entire standard organoid showing the spatial restriction of nephron structures to the edge of the organoid (middle), and magnified image of the boxed area showing a nephron within that organoid (right). (B) Bright-field image of kidney micro-organoids (left) and magnified bright-field image of the boxed area, showing a single kidney micro-organoid (middle), and confocal immunofluorescence image of kidney micro-organoids at day 7+11 (right). (C) Change in size of the organoids at different stages of development. (D) Fold change in cell number (and scalable capacity) of micro-organoids compared with standard organoid over time. Scale bars: 500 µm (A, left); 200 µm (A, middle and right, B).

