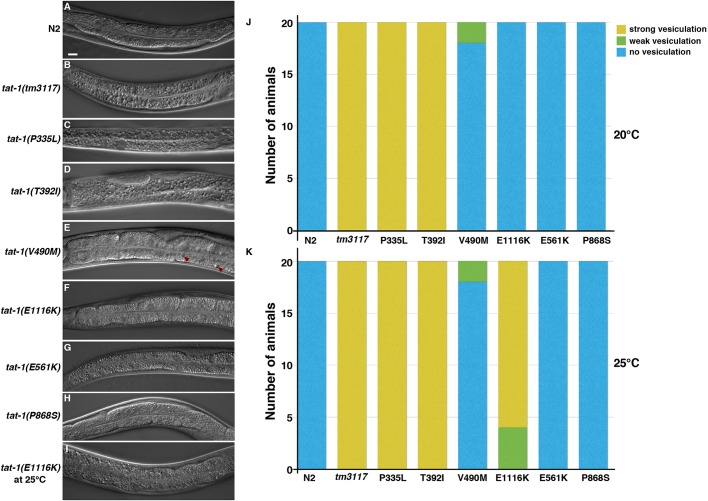
Fig. 2.
Vacuolar gut phenotypes of the tat-1 mutants. (A–I) Representative images of the intestines of two control strains (N2 and tm3117) and six tat-1 mutants at 20°C (A-H) or 25°C (I) are shown. Red arrowheads indicate the minor vesicular defect in the intestine. Scale bar: 10 μm for all images. (J,K) Gut vesiculation defects of the tat-1 mutants scored at 20°C (J) and 25°C (K) are shown (n=20). Yellow, green and blue indicate strong, weak and no defects, respectively.

