Fig. 1.
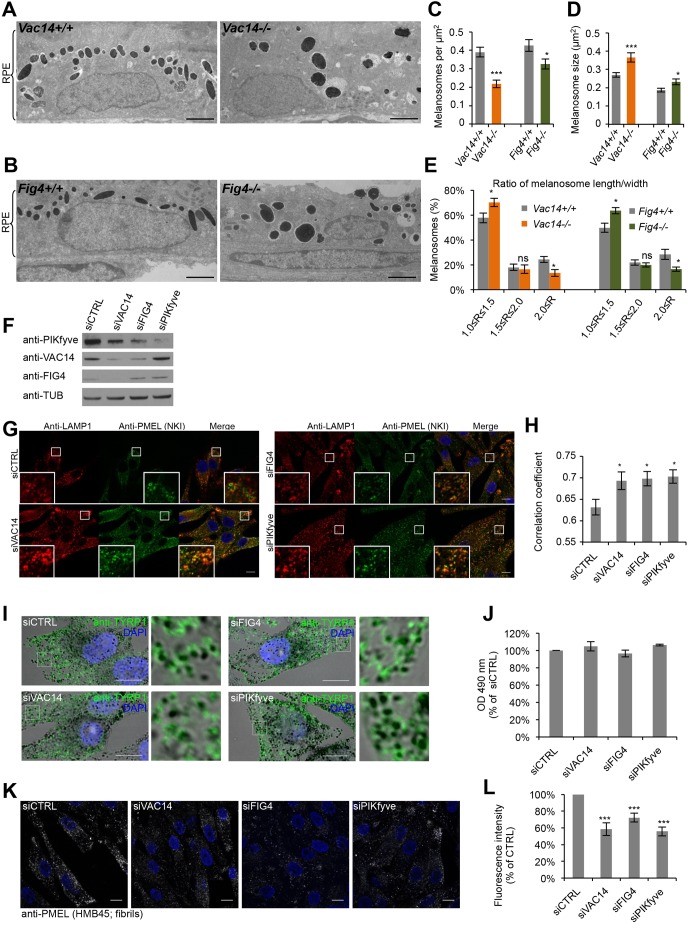
Interference with the PIKfyve complex affects melanosome morphology and identity. (A,B) EM analysis of Epon-embedded RPE of newborn Vac14+/+ and Vac14−/− mice (A) and Fig4+/+ and Fig4−/− mice (B). Scale bar: 2 µm. (C–E) Quantification of melanosome number per µm2 RPE (C), melanosome size (D) and the ratio (R) of maximal width and length of melanosomes (E). (F) MNT-1 cells were treated with control siRNAs or siRNAs against VAC14, FIG4 and PIKfyve and knockdown efficiencies were analyzed by immunoblotting. Antibodies to tubulin (anti-TUB) were used as equal loading marker. (G) MNT-1 cells treated with siRNAs as in F were fixed, permeabilized and immunolabeled using anti-LAMP1 (red) and anti-PMEL-NKI antibodies (green). DAPI was used to stain nuclei. Insets show magnifications of the boxed regions. Scale bars: 10 µm. (H) Quantification of colocalization between LAMP1 and PMEL fluorescence. (I) MNT-1 cells treated with control siRNAs or siRNAs against VAC14, FIG4 or PIKfyve were fixed, permeabilized and immunolabeled using anti-TYRP1 antibody (green) and DAPI (blue) to stain nuclei. Pigmented melanosomes are shown in bright-field images. Panels on the right show magnifications of the boxed regions. Scale bars: 10 µm. (J) Quantification of melanin content of MNT-1 cells treated with control siRNAs or siRNAs against VAC14, FIG4 or PIKfyve. (K) MNT-1 cells treated with control siRNAs or siRNAs against VAC14, FIG4 or PIKfyve were fixed, permeabilized and immunolabeled using DAPI (blue) to stain nuclei and anti-PMEL (HMB45) antibody (gray), which recognizes PMEL fibrils. Scale bars: 10 µm. (L) Quantification of the mean fluorescence intensity per cell normalized to siCTRL for experiments as in K. Means±s.e.m. shown for n≥3 in all panels. *P<0.05; ***P<0.001; ns, not significant (unpaired Student's t-test, unequal variance). See also Fig. S1.

