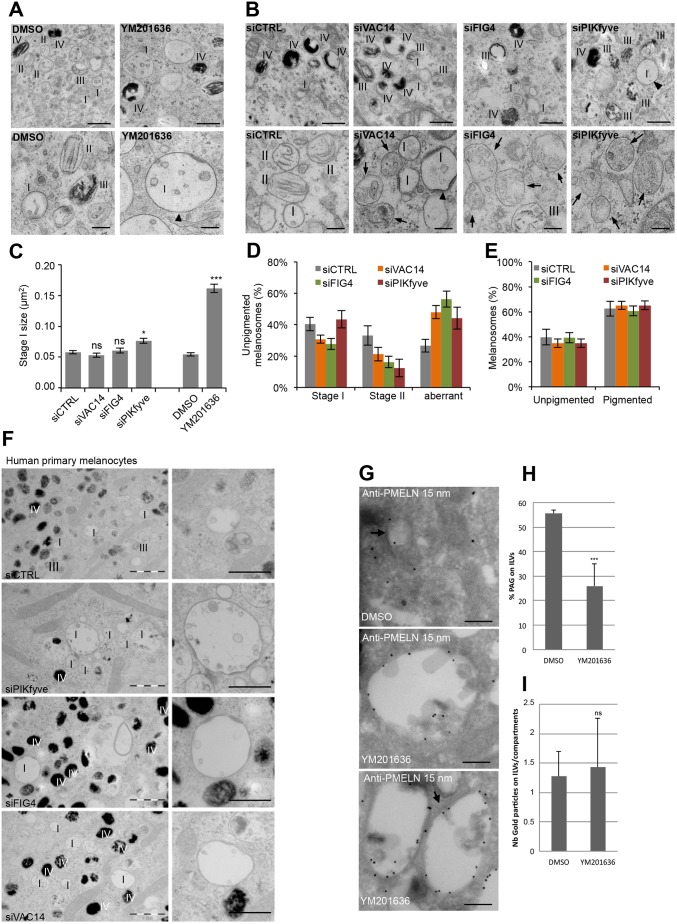
Fig. 4.
PMEL fragments accumulate in enlarged EEA1 compartments. (A,B) EM analysis of Epon-embedded MNT-1 cells treated for 2 h with the PIKfyve inhibitor YM201636 (A) or knocked down for VAC14, FIG4 and PIKfyve (B). Upper panels show low-magnification overviews of unpigmented and pigmented melanosomes, and lower panels show unpigmented melanosomes at higher magnification. Arrowheads point towards enlarged stage I melanosomes and arrows highlight aberrant unpigmented melanosomes containing unstructured aggregates present in VAC14, FIG4 and PIKfyve knockdown cells. I–IV indicates the melanosome stage. Scale bars: 500 nm (upper panels), 200 nm (lower panels). (C) Quantification of stage I melanosome size. (D) Quantification of unpigmented melanosomes grouped into stage I, stage II and aberrant melanosomes. (E) Quantification of pigmented and unpigmented melanosomes expressed as a percentage of the total number of melanosomes. (F) EM analysis of Epon-embedded human primary melanocytes treated with control siRNAs or siRNAs against VAC14, FIG4 and PIKfyve. Right panels show magnifications of stage I melanosomes. I–IV indicates the melanosome stage. Scale bars: 1 µm (left panels), and 500 nm (right panels). (G) Ultrathin cryosections of MNT-1 cells treated for 2 h with 1.6 µM YM201636 or DMSO were immunogold-labeled using anti-PMEL-N antibody followed by protein-A conjugated to 15 nm diameter gold. Arrows indicate clathrin coats. Scale bars: 200 nm. (H) Quantification of the percentage of gold particles on ILVs expressed as a percentage of the total number of gold particles. (I) Quantification of the number of gold particles on ILVs per compartment. Means±s.e.m. shown for n≥3 in all panels. *P<0.05; ***P<0.001; ns, not significant (unpaired Student's t-test, unequal variance).

