Fig. 5.
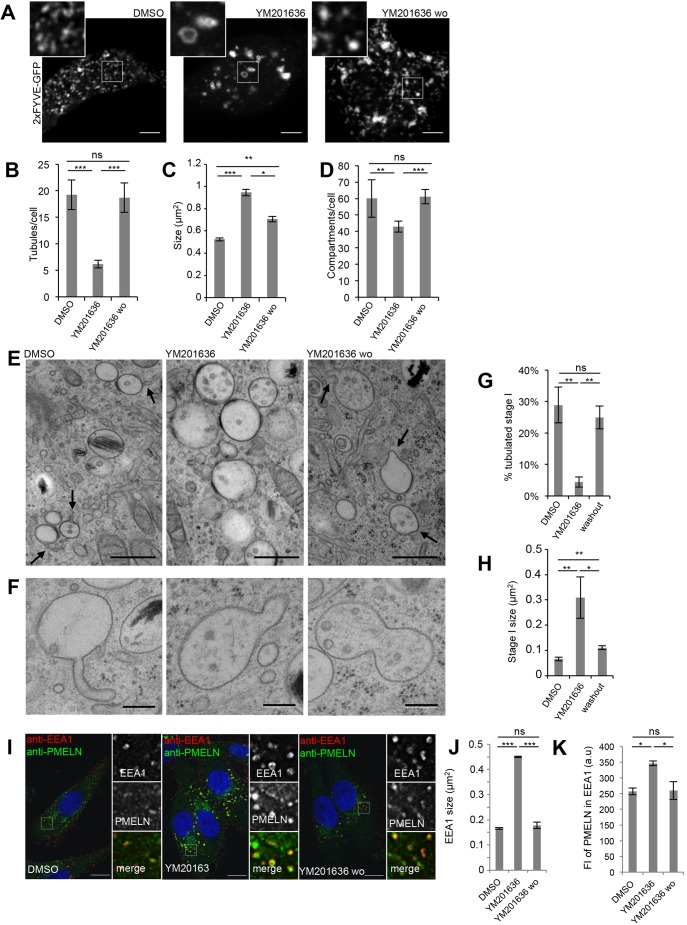
PIKfyve activity promotes formation of membrane tubules that modulate PMEL accumulation. (A) Snapshots of live 2×FYVE–GFP-transfected MNT-1 cells treated for 2 h with DMSO or 1.6 μM YM201636, and when subsequently YM201636 was washed out (wo) for 4 h. Magnifications of the boxed regions illustrate the absence of membrane tubules in PIKfyve inhibitor-treated cells. Scale bars: 10 µm. (B–D) Quantification of 2×FYVE–GFP-labeled tubules per cell (B), and of the 2×FYVE–GFP compartment size (C) and number per cell (D). (E) EM analysis of HPF/freeze substituted MNT-1 cells treated for 2 h with DMSO or 1.6 µM YM201636, and when subsequently YM201636 was washed out (wo) for 4 h. Arrows point at membrane tubules and deformations. Scale bars: 500 nm. (F) Examples of compartments undergoing membrane remodeling upon 4 h of YM201636 washout. Scale bars: 200 nm. (G,H) Quantification of the percentage of tubulated stage I melanosomes (G) and of stage I melanosome size (H) from experiments as in E. (I) MNT-1 cells treated as indicated were fixed, permeabilized and immunolabeled using DAPI (blue) to stain nuclei and anti-PMEL-N (green) and anti-EEA1 (red) antibodies to label the PMEL/M-α and stage I melanosomes, respectively. Panels on the right show magnifications of the boxed regions. wo, wash out of the YM drugs as performed in A–D. Scale bars: 10 µm. (J,K) Quantification of EEA1 size (J) and the mean fluorescence (FI) of PMELN in EEA1 compartment (K). Means±s.e.m. shown for n≥3 in all panels. *P<0.05; ***P<0.001; ns, not significant (unpaired Student's t-test, unequal variance).

