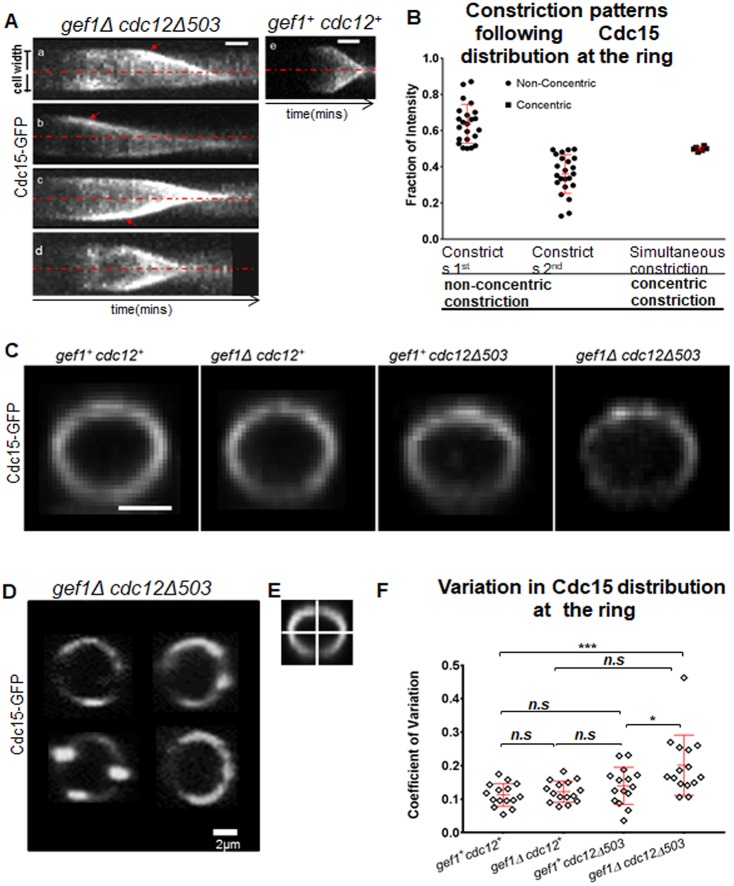
Fig. 2.
Cells displaying non-concentric furrow formation exhibit uneven Cdc15 distribution along the ring. (A) Kymographs from time-lapse movies showing constriction of Cdc15–GFP-labeled rings in gef1Δcdc12Δ503 and gef1+cdc12+ cells. Red dashed lines indicate the central axis of the cells. Red arrows show regions of the ring constricting faster. (B) Quantification of the fraction of Cdc15–GFP intensity at different regions of the ring immediately prior to the onset of constriction. In kymographs of the cells constricting non-concentrically, the side of the ring constricting first was compared to the side that constricted second. Rings constricting concentrically displayed simultaneous constriction of both sides of the kymograph. n=25 cells. (C) 3D-reconstructed Cdc15–GFP-labeled actomyosin ring of the indicated strains. (D) Examples of Cdc15–GFP distribution along the ring in gef1Δcdc12Δ503 cells. (E) Illustration of actomyosin ring quadrants used for analyzing the CV of Cdc15–GFP distribution. (F) Quantification of the CV of Cdc15–GFP distribution in the indicated strains [n=15 cells; *P=0.025, **P=0.0023, ***P=0.0005; n.s., not statistically significant; one-way ANOVA (F(3,56)=7.163, P=0.0004), with Tukey's multiple comparisons post hoc test]. Error bars represent standard deviation. Scale bars: 2 μm.

