Fig. 4.
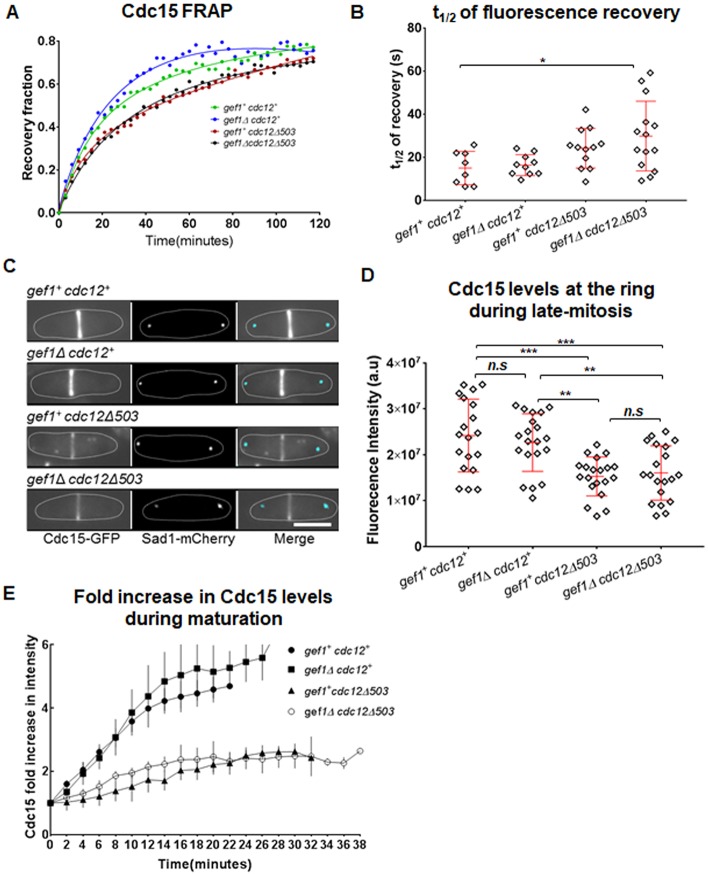
Activated cdc12 mutants display reduced Cdc15 levels in the ring. (A) Quantification of fluorescence recovery after photobleaching (FRAP) of Cdc15–GFP at the ring during maturation in the indicated strains. (B) Quantification of the t1/2 of FRAP of Cdc15–GFP in the indicated strains [n≥9 cells; *P≤0.05; one-way ANOVA (F(3,41)=3.667, P=0.0198) with Dunnett's multiple comparisons test]. (C) Sum projections of cells expressing Cdc15–GFP in late mitosis. The spindle pole bodies are labeled with Sad1–mCherry. (D) Quantification of fluorescence intensity of Cdc15–GFP at the actomyosin ring in the indicated strains [n=20 cells; **P≤0.01; ***P≤0.001; n.s., not statistically significant; one-way ANOVA (F(3,75)=10.52, P<0.0001) with Tukey's multiple comparisons post hoc test]. (E) Quantification of fold increase in Cdc15 levels during maturation in the indicated strains. Error bars represent standard deviation. Scale bar: 5 µm.

