Fig. 7.
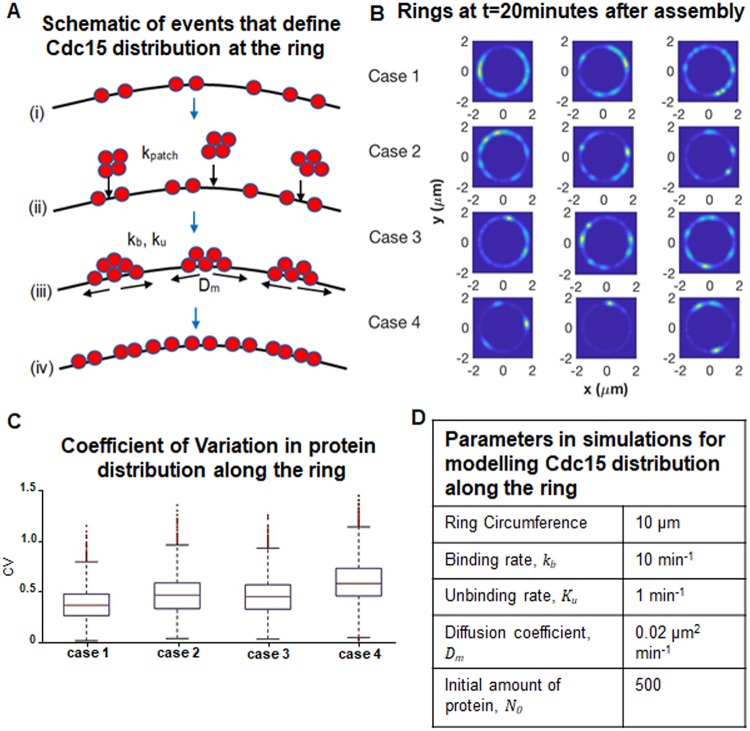
A mathematical model defines Cdc15 protein distribution along the ring during cytokinesis. (A) Schematic of model (from top down): (i) a small initial population of Cdc15 proteins (red) are randomly distributed on the ring; (ii) patches of Cdc15 proteins (from endocytic patches) associate to random locations on the ring at rate kpatch; (iii) proteins can bind to (rate kb) and unbind from (rate ku) each other and diffuse along the ring with diffusion coefficient Dm; (iv) as time progresses, proteins accumulate and become distributed along the ring. (B) The spatial distribution of Cdc15 along the ring at t=20 min. Three independent simulated rings are shown for each of the four simulated cases. (C) Box plots of the CV for 10,000 simulations of each of the four simulated cases. For each box, the central (red) mark is the median, the edges of the box are the 25th and 75th percentiles, and the whiskers extend to the most extreme data points not considered outliers. Outliers are plotted individually. The differences between all pairs of cases are significant with P-values all below 4×10⁻⁵. (D) Parameter values used in all ring simulations. The number of proteins was obtained from previously published work (Wu and Pollard, 2005).

