Fig. 1.
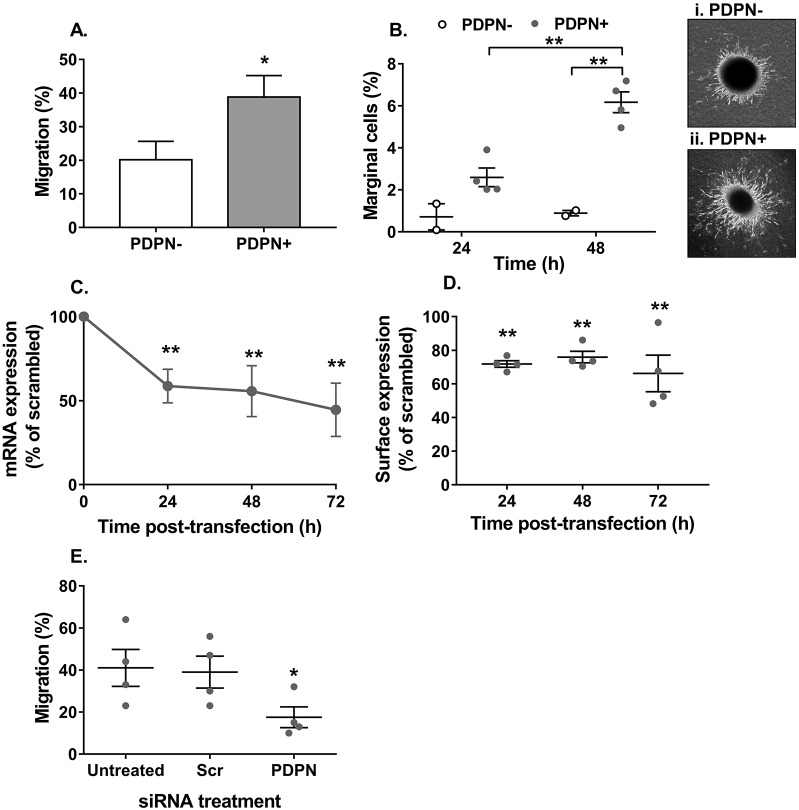
Podoplanin expression regulates MSC migration. Podoplanin-negative (PDPN−) and -positive (PDPN+) MSCs were seeded (A) onto an 8 µm pore filter, or (B) in a spheroid cultured on a collagen matrix. In A, migration was assessed at 48 h by counting the number of cells detached from the upper and lower chamber. Data are expressed as the number of cells in the lower chamber as a percentage of the total cell count for both chambers. *P<0.05 by unpaired t-test. In B, migration was assessed at 24 h and 48 h by counting the number of cells migrating along the surface of the collagen matrix and expressing it as a percentage of the total number of cells seeded. Two-way ANOVA: P<0.05 for time, P<0.01 for podoplanin status; **P<0.01 by Bonferroni post-test. Representative images of (i) PDPN− and (ii) PDPN+ MSCs migrating away from the spheroid and into the collagen gel. (C–E) Podoplanin-positive MSCs transfected with Lipofectamine (untreated) containing non-specific siRNA (Scr) or siRNA against podoplanin (PDPN) were seeded onto an 8 µm pore filter. In C, podoplanin mRNA expression was assessed over 72 h by qPCR and data are expressed as the 2−ΔCT normalised to the percentage of the scrambled control. Two-way ANOVA: P<0.05 for time, P<0.001 for siRNA duplex; **P<0.01 by Dunnett post-test compared to scrambled control. In D, podoplanin protein expression was assessed over 72 h by flow cytometry and data expressed as the MFI normalised to the percentage of the scrambled control. Two-way ANOVA: P<0.01 for siRNA duplex; P>0.05 for time, **P<0.01 by Bonferroni post-test compared to scrambled control. In E, the effect of podoplanin siRNA on migration was assessed at 48 h by counting the number of cells detached from the upper and lower chamber. Data are expressed as the number of cells in the lower chamber as a percentage of the total cell count for both chambers. One-way ANOVA: P<0.05; *P<0.05 by Dunnett’s post-test compared to untreated control. Data are mean±s.e.m. from (A) n=8 PDPN− MSCs and n=7 PDPN+ MSCs, (B) n=2 PDPN− MSCs and n=4 PDPN+ MSCs, and (D,E) n=4 independent experiments using different biological donors for each cell type in each independent experiment. In C, data are mean±s.d. for n=3 independent experiments each using different biological donors for each cell type, where each data point per experiment was derived from the mean of three technical replicates.

