Fig. 3.
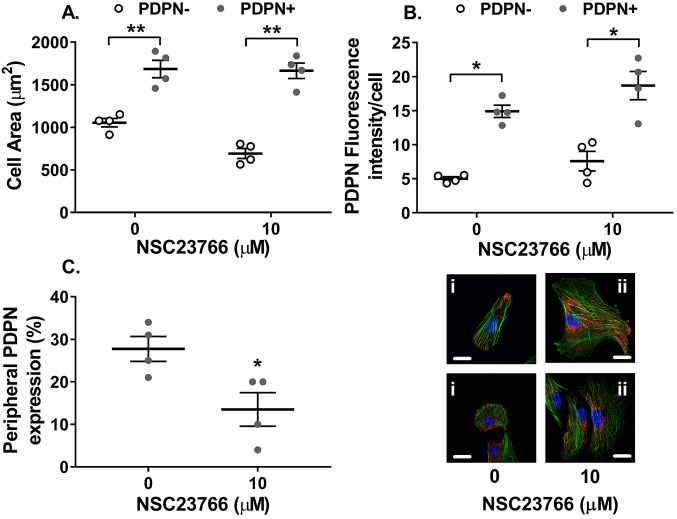
Rac-1 inhibition alters the cellular location of podoplanin on MSCs. Podoplanin-negative (PDPN−) and -positive (PDPN+) MSCs treated with or without the Rac-1 inhibitor NSC23766 (10 µM) for 24 h. Cellular localisation of podoplanin and F-actin was assessed by confocal microscopy. (A) Cell area was calculated as the total area of F-actin (green) staining divided by the number of nuclei (blue) and expressed as µm2. Two-way ANOVA: P<0.001 for podoplanin expression, P>0.05 for Rac-1 inhibition; **P<0.01 by Bonferroni post-test compared to PDPN− MSCs. (B) Fluorescence intensity of podoplanin (red) staining was assessed by using ImageJ and expressed as the integrated density per cell. Two-way ANOVA: P<0.01 for podoplanin expression, P>0.05 for Rac-1 inhibition; *P<0.05 by Bonferroni post-test compared to PDPN− MSCs. (C) The number of cells where podoplanin expression was confined to the tip of pseudopod was assessed and expressed as the percentage of total number of cells expressing podoplanin. *P<0.05 by paired t-test. Representative images of (i) untreated or (ii) NSC23766-treated PDPN+ MSCs, where podoplanin is red, F-actin is green and nuclei are blue. Data are mean±s.e.m. from n=4 independent experiments using different biological donors for each cell type in each independent experiment. Scale bars: 10 µm.

