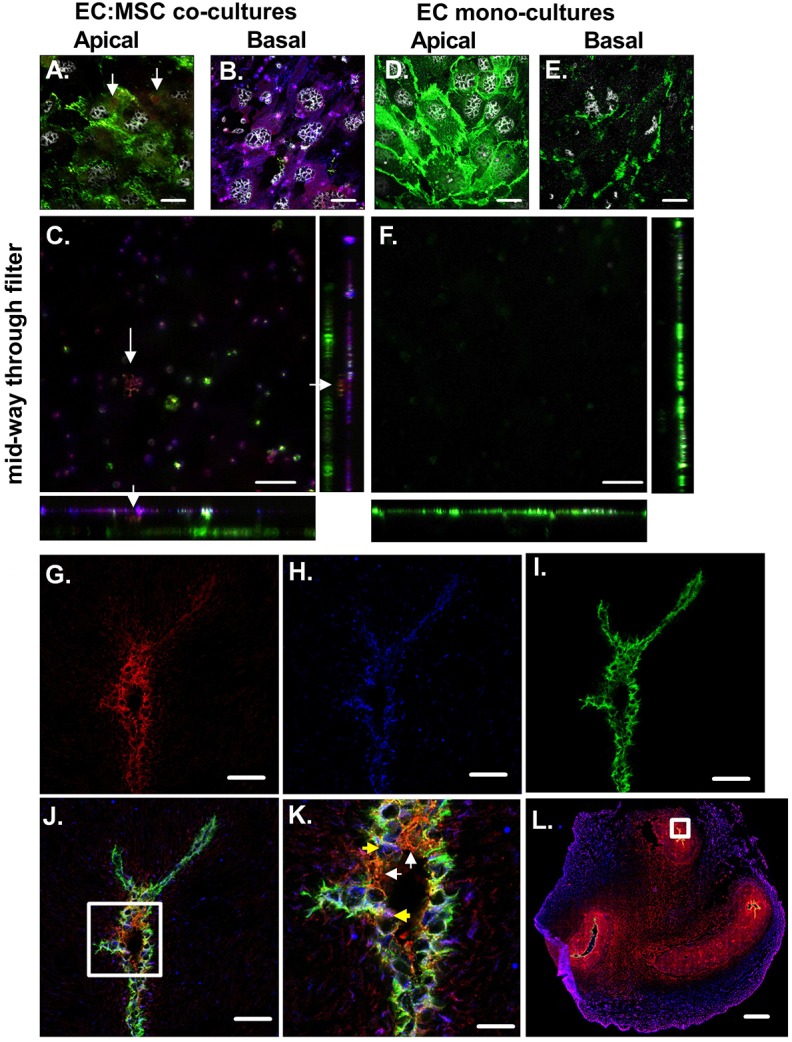
Fig. 6.

Podoplanin-expressing MSCs can protrude through endothelium. Cells cultured on Transwell filters (A–F) or in umbilical cord tissue sections (G–L) were stained for podoplanin, along with markers of ECs (CD31) and MSCs (CD90). (A) Monolayer of CD31-positive ECs in green on the apical surface of the filter for an EC:MSC co-culture filter. Arrows indicate red podoplanin staining on the apical surface of the filter. (B) Monolayer of MSCs expressing CD90 (in blue) and podoplanin (in red), where dual-positive cells are purple, on the basal surface of the filter for an EC:MSC co-culture filter. (C) Image obtained mid-way through the filter for an EC:MSC co-culture. Arrows indicate podoplanin from the basal MSC layer protruding up through the filter. Monolayer of CD31-positive ECs in green on the (D) apical and (E) basal surface of the filter for an EC mono-culture. (F) Image obtained mid-way through the filter for an EC mono-culture. (G) CD90 expression in red around vessels in the umbilical cord. (H) Podoplanin expression in blue around vessels in the umbilical cord. (I) CD31 expression in green around vessels in the umbilical cord. (J) CD31, podoplanin and CD90 expression around vessels in the umbilical cord. The white box represents the area magnified in panel K. (K) Zoomed image of CD31, podoplanin and CD90 expression. White arrows indicate cells positive for CD31 and CD90, but not podoplanin. Yellow arrows indicate cells appearing positive for all three markers. (L) CD31, podoplanin and CD90 expression across the entire umbilical cord section. The white box represents the zoomed in areas for G–J. Representative confocal images, obtained of using Zen Black software, are shown. Scale bars: 20 µm (A–F,K), 50 µm (G–J), 1 mm (L).
