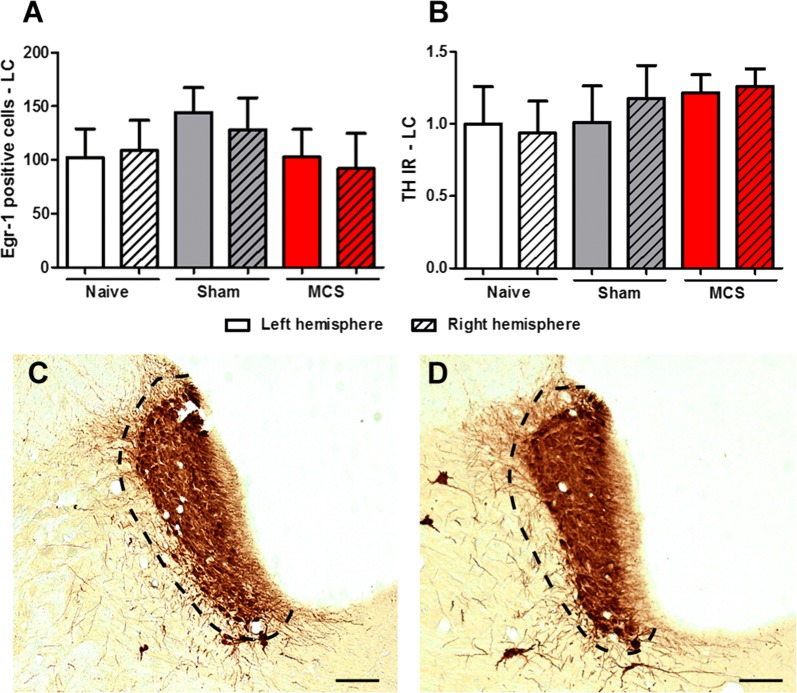
Fig. 4.
Involvement of LC in antinociception induced by MCS. Quantification of Egr-1 (A) and TH (B) IR in the LC of naive (without surgical intervention), sham (with epidural electrodes but without stimulation) and stimulated (MCS, 1.0 V/60 Hz/210 µs, 15 min) rats. Values represent the mean ± SEM (n = 5 animals per group). Photomicrographs illustrating the TH-IR in the LC of sham (C) and stimulated (D) rats. IR immunoreactivity, LC locus coeruleus, MCS motor cortex stimulation, TH tyrosine hydroxylase. Scale bars: 200 µm

