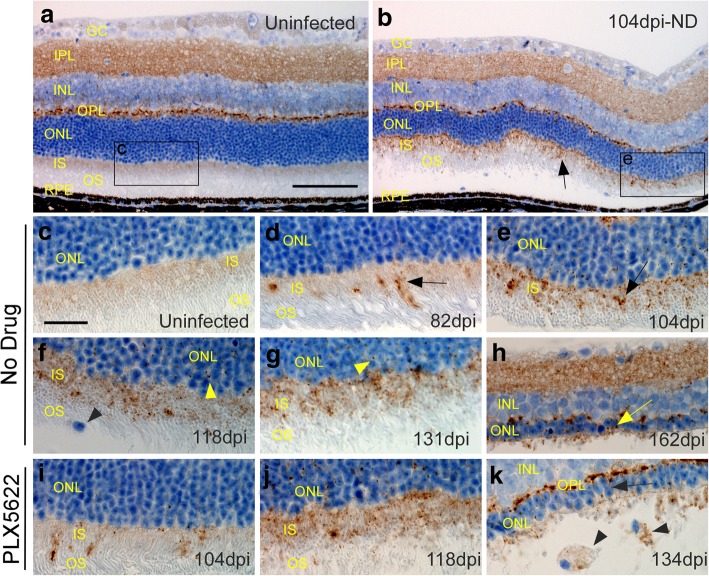
Fig. 9.
PrPSc deposition in retinas at various times after 79A scrapie infection. All panels show tgGFP/RFP mouse retinal sections stained with D13 anti-PrP monoclonal antibody. a In a control uninfected mouse, PrP staining (brown) was seen in the IPL, INL and OPL regions. In addition, a faint tan stain could be seen in the IS region of the photoreceptor cells. All the staining in this field was likely to be normal host PrPC since the mouse was uninfected. Furthermore, these areas were not stained in PrP null mice. b At 104 dpi in aninfected mouse from the ND group additional new PrP staining in punctate granular accumulations was observed in the IS region (arrow). This material appeared to be disease-associated PrPSc. c-k. More detailed view of the IS region was seen at higher magnification. c Uninfected mouse with faint brown blush in IS region. d Eighty two dpi ND mouse with earliest appearance of clumped PrPSc staining in IS (arrow). e, f, g On subsequent days (104, 118, 131dpi) PrPSc appeared to accumulate progressively in the IS region (arrows), and small punctate deposits could also be seen in the ONL (yellow arrowheads). One mononuclear microglial cell was present in the OS layer (black arrowhead). h At 162dpi severe retinal degeneration was observed, and the ONL was reduced to a single layer of nuclei (yellow arrow). OS and IS regions were almost totally absent, and only faint PrPSc staining remained. i, j In PLX5622-treated mice at 104 and 118dpi, PrPSc staining was similar to staining in the ND mice. k At 134dpi severe retinal degeneration was seen. Two mononuclear cells with phagocytosed PrPSc were seen in the area of the former OS region (black arrowheads). These pictures are representative of the following mice: 4 uninfected ND, 16 infected ND and 10 infected PLX treated. Mice were examined at 9 timepoints between 67 and 163 dpi, and representative mice from timepoints showing typical early to middle retinal degeneration were shown in this figure. a, b scale bar = 100 μm, c-k scale bar = 25 μm

