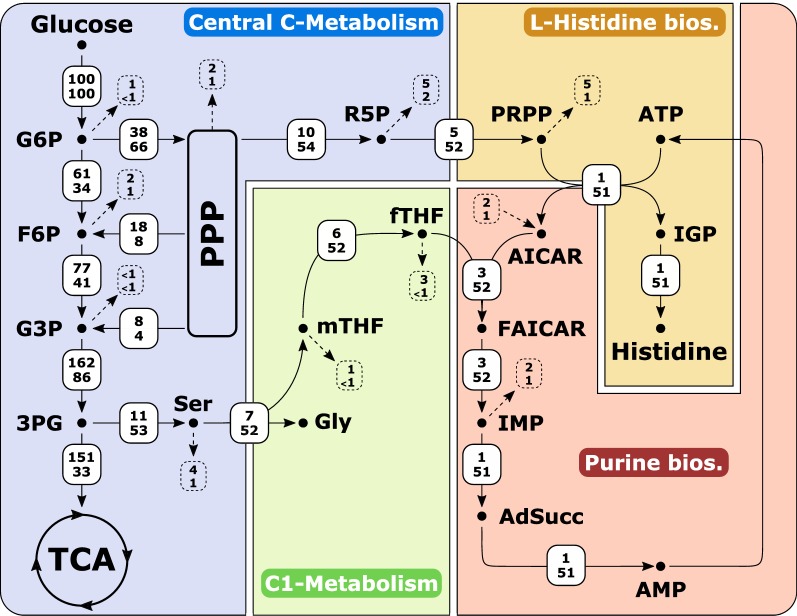
Fig. 5.
Flux distribution of WT-like growth (upper number) and growth coupled l-histidine production (lower number) in C. glutamicum. All fluxes are given in percent (%) of glucose uptake rate, which was set to 3.94 mmol gCDW−1 h−1 [12] for both simulations. Additional constraint for growth coupled l-histidine production: μ = 0.1 h−1. Dotted lines show respective flux to biomass. For abbreviations see Fig. 1

