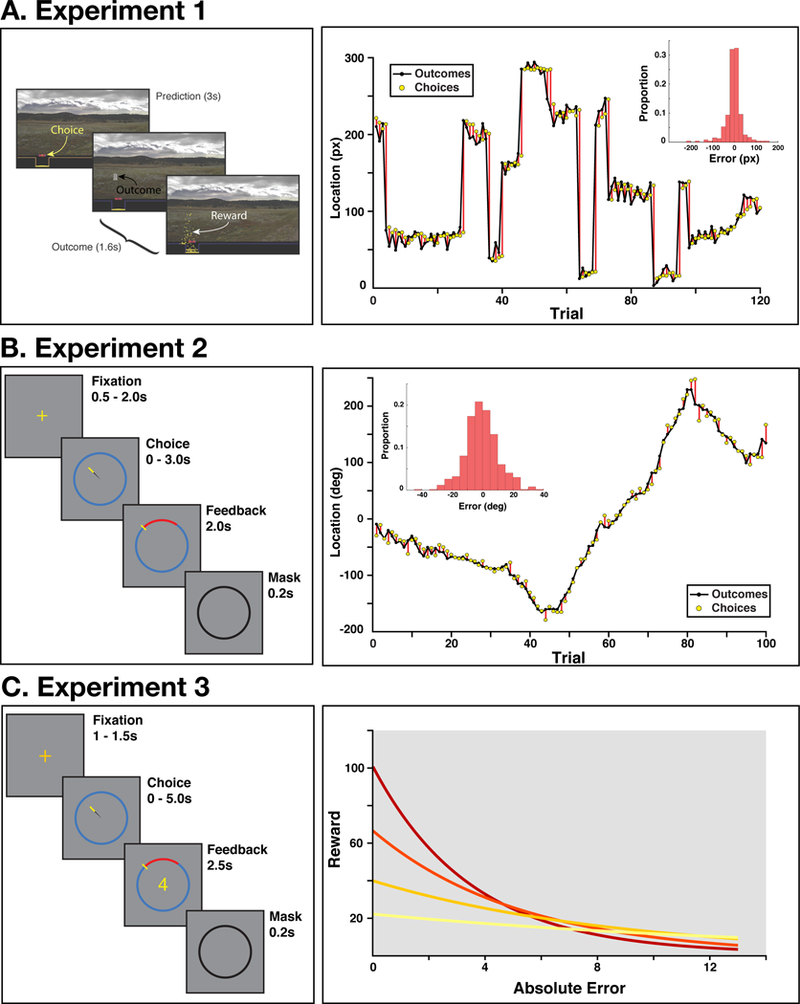
Figure 2. Experimental tasks.

A) Left: On each trial of Experiment 1, participants selected a horizontal location with a joystick and were then shown the correct location. On a random subset of trials, participants received performance-contingent rewards (shown as gold coins). Figure adapted from McGuire et al., 2014, permission pending Right: A representative block of trials from an example participant. The mean correct location was stable for a variable number of trials, and then was uniformly resampled. Inset histogram: The distributions of errors for this participant across their session. B) Left: Participants in Experiment 2 selected a location on the circle with their mouse, and then were shown the correct location. Right: A representative block of trials, demonstrating that the mean correct location changed gradually over time. As seen in the histogram for an example participant (inset), the gradual changes in location for this task resulted in error distributions that were less peaked than in Experiment 1 (compare Panel A inset). C) Left: Experiment 3 was identical to Experiment 2, but participants were rewarded based on their accuracy, according to one of four reward-error functions. They were informed of the current reward mode during Fixation, and during Feedback they received the reward corresponding to their accuracy on that trial (conditional on the current reward mode). Right: Error-reward slopes for the four reward modes.
