
Figure 3. Experiment 1 Results.
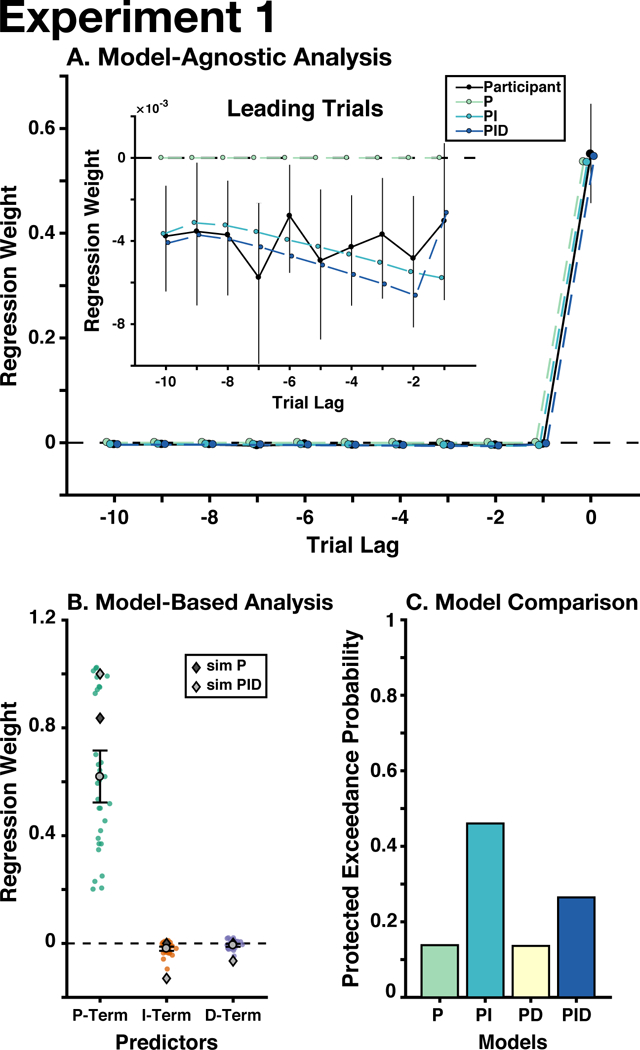
A) For our model-agnostic analyses, we regressed the errors that participants made on the current and ten leading trials on their current update (black: participants’ regression weights). Next, we used the PID parameters estimated in our regression analysis to generate behavior from P, PI, and PID controllers, and fit our lagged regression to this simulated behavior (colored lines). Inset: the regression weights from only the leading trials (i.e., before the current trial), controlling for the effect of the current trial. B) For our model-based analyses, we regressed the trial-wise P-, I-, and D-Terms on participants’ updates, and found that all three terms were significantly different from zero. Colored circles indicate individual participants’ regression weights. Dark gray diamonds indicate the mean gains from the best-performing delta-rule models, based on each participant’s outcome history; light gray diamonds indicate the mean gains from the best-performing PID controllers. C) We used Bayesian model selection to adjudicate between our candidate models, finding that the PI model best explained the data, albeit with moderate support (see text). Error bars throughout indicate mean and between-participant bootstrapped 95% confidence intervals.