
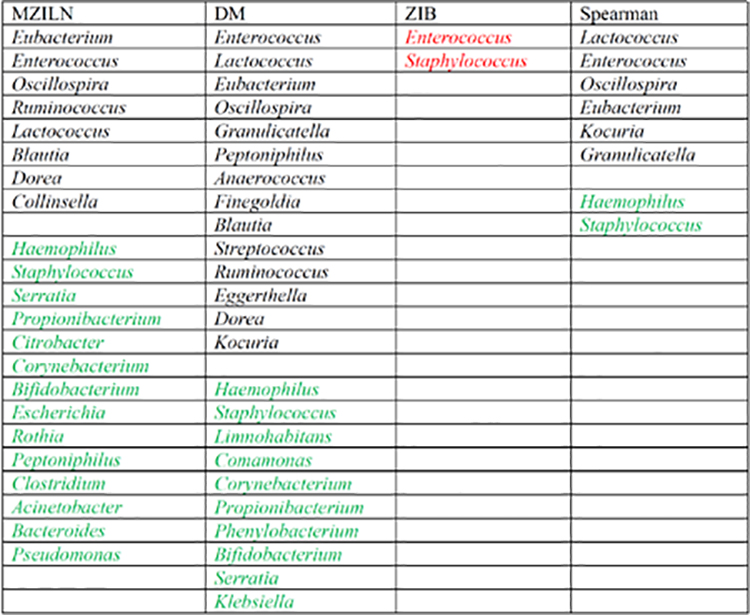
Table 3.
Genera identified to be associated with feeding type. Black and green indicate positive and negative associations respectively. Red indicates that the direction of the identified association is unknown. The genera are sorted by associatio n strength (measured by magnitude of estimated effect size or p value) from strongest to weakest in each category.
|