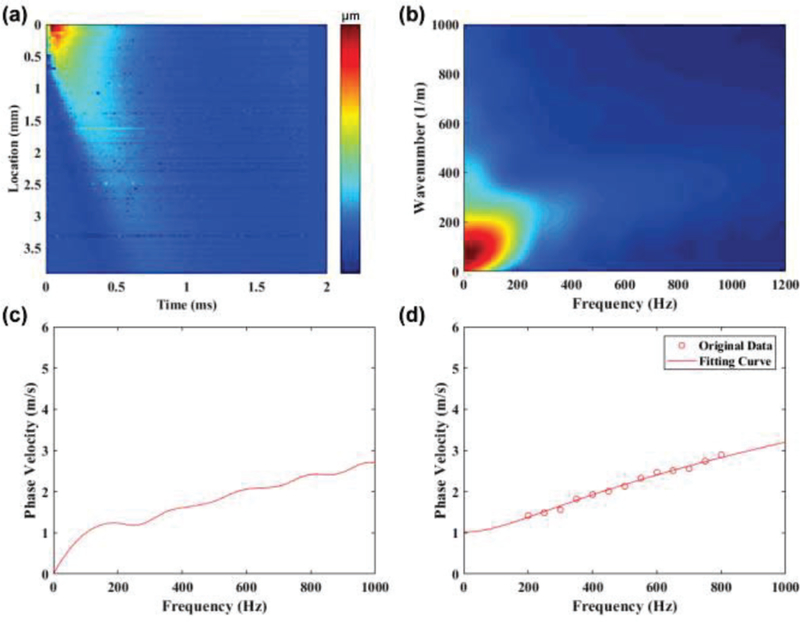
Fig. 2.
The post-processing procedures to emphasis how to get the phase velocity curve from the experimental collected axial displacement maps. (a) axial displacement map, (b) k-space, (c) phase velocity curve, and (d) fitting curve with selected frequency range from 200 Hz to 800 Hz with a 50 Hz interval.

