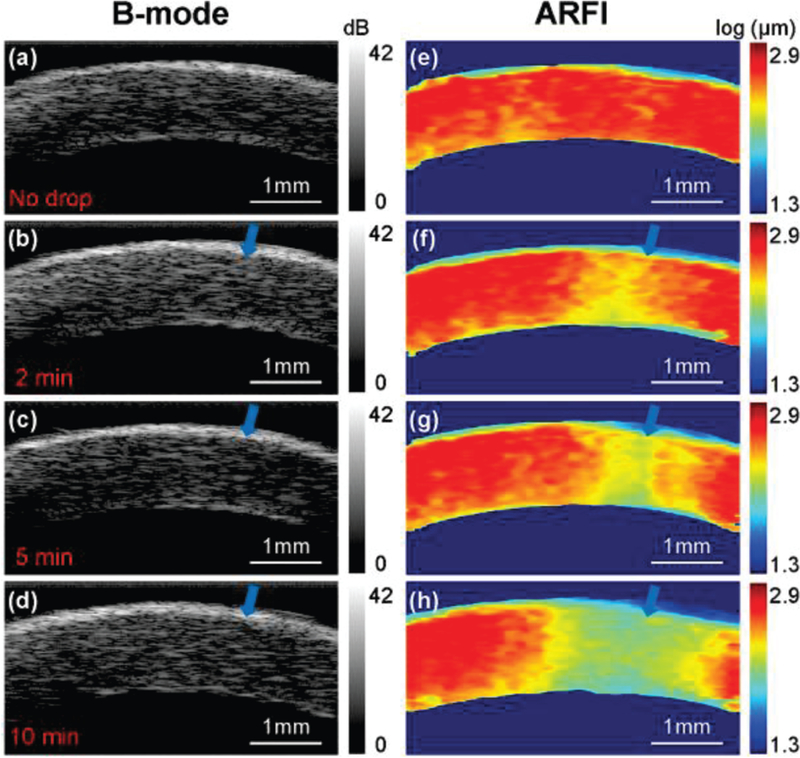
Fig. 3.

A time series of B-mode and ARFI images for one cornea sample. The blue arrow indicates the small spot of formalin drop between each time-point. (a,e) control group with no formalin drop; experimental groups with (b,f) 2 minutes, (c,g) 5 minutes and (d,h) 10 minutes formalin drop. In the cross-linking experiments, the intraocular pressure was set at 5 mmHg so as to maintain normal corneal curvature.
