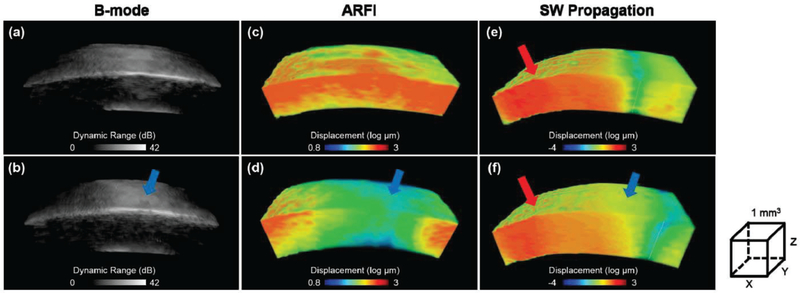
Fig. 4.
The reconstructed 3D B-mode and ARFI maps of another cornea. (a,c) control group, (b,d) experimental group with 20 minutes formalin drop, (e,f) one moment (1.5 ms after ARF pushing) of the shear wave propagation where gray dash lines represent current wave fronts position. The red arrow indicates the ARF pushing location which is 2 mm away from the central cornea. The blue arrow indicates the site of small spot formalin drop. Volume dimensions (xyz) are 4.8 mm ×1.5 mm ×1 mm for (a-d) and 6 mm ×1.5 mm ×1 mm for (e-f), respectively.

