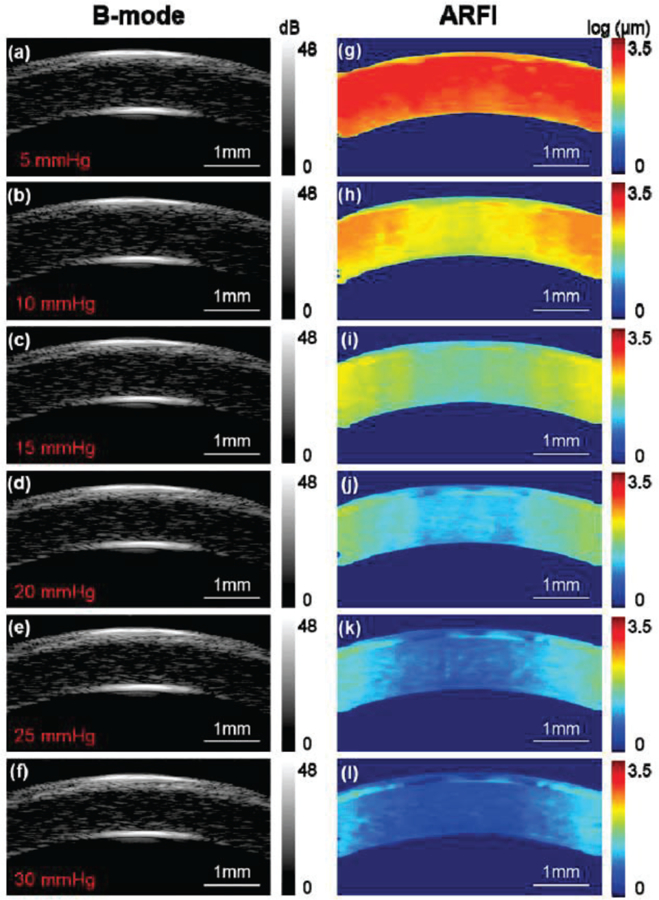
Fig. 5.

B-mode and ARFI images of the cornea under various intraocular pressures. (a,g) – 5 mmHg, (b,h) – 10 mmHg, (c,i) – 15 mmHg, (d,j) – 20 mmHg, (e,k) – 25 mmHg and (f,l) – 30 mmHg. The ROI is +/− 0.5 mm of the central cornea which was relative uniformly distributed demonstrated by high resolution ARFI images. Note: the cornea here is not formalin-treated.
