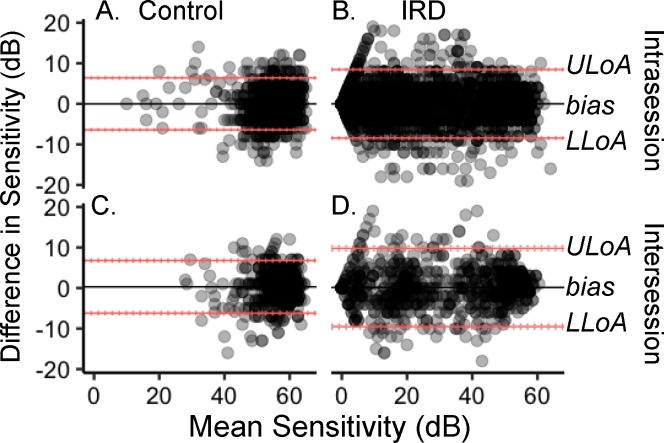
Figure 4.
Bland-Altman plots of (A) control intrasession pointwise sensitivity, (B) IRD intrasession PWS, (C) control intersession PWS, and (D) IRD intersession PWS. Sensitivity difference between tests is the bias (black solid lines). The upper and lower limits of agreement (ULoA and LLoA, respectively) are the red solid lines with the 95% CI shown as the dotted red lines around each LoA.

