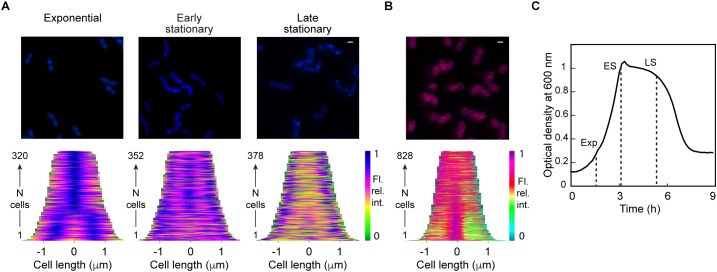
Figure 1.
Streptococcus pneumoniae membrane characterization. (A) Cells at different stages of culture stained with NAO (blue) and the corresponding demographs showing the distribution of the fluorescent signals along the main cell axis in the population. (B) Cells stained with FM4-64 (magenta) and the corresponding demograph. The scale bar is 1 μm. Note that colors do not reflect the emission wavelength of the fluorophores but were chosen to ensure consistency across the different experiments and figures. (C) Typical growth curve of S. pneumoniae in CY-medium at 37°C. The dashed lines indicate the analyses during the exponential growth (Exp), and the early and late stationary phases (ES and LS, respectively).

